LEP AddeNDUM - Livingston County Children`s Network
advertisement
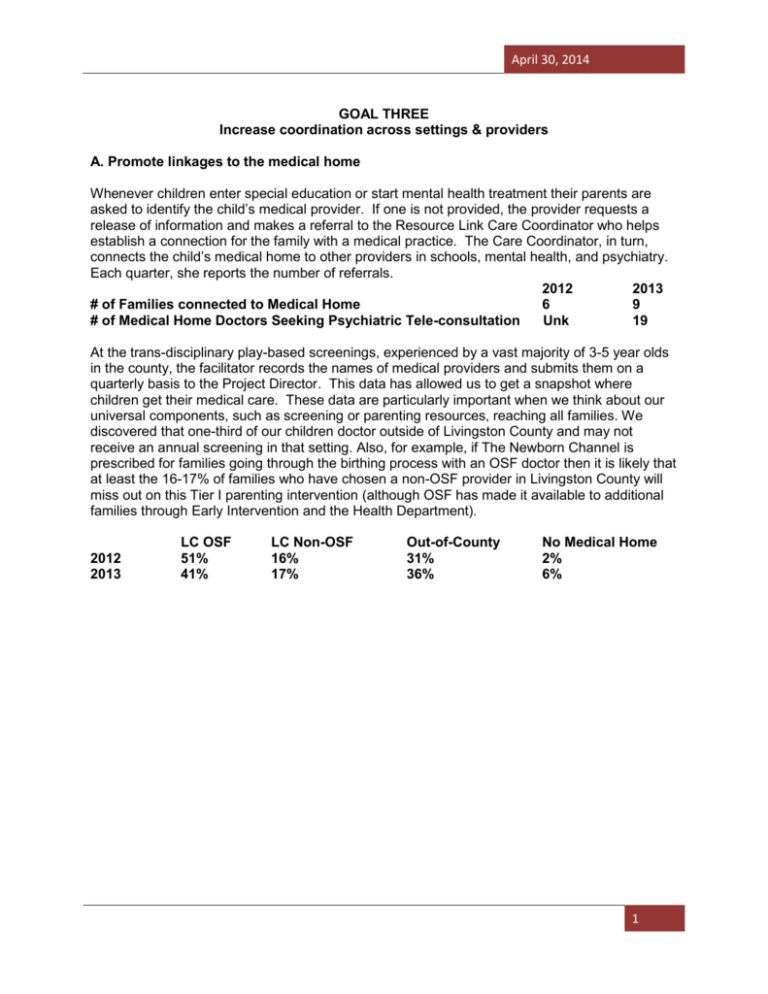
April 30, 2014 GOAL THREE Increase coordination across settings & providers A. Promote linkages to the medical home Whenever children enter special education or start mental health treatment their parents are asked to identify the child’s medical provider. If one is not provided, the provider requests a release of information and makes a referral to the Resource Link Care Coordinator who helps establish a connection for the family with a medical practice. The Care Coordinator, in turn, connects the child’s medical home to other providers in schools, mental health, and psychiatry. Each quarter, she reports the number of referrals. 2012 2013 # of Families connected to Medical Home 6 9 # of Medical Home Doctors Seeking Psychiatric Tele-consultation Unk 19 At the trans-disciplinary play-based screenings, experienced by a vast majority of 3-5 year olds in the county, the facilitator records the names of medical providers and submits them on a quarterly basis to the Project Director. This data has allowed us to get a snapshot where children get their medical care. These data are particularly important when we think about our universal components, such as screening or parenting resources, reaching all families. We discovered that one-third of our children doctor outside of Livingston County and may not receive an annual screening in that setting. Also, for example, if The Newborn Channel is prescribed for families going through the birthing process with an OSF doctor then it is likely that at least the 16-17% of families who have chosen a non-OSF provider in Livingston County will miss out on this Tier I parenting intervention (although OSF has made it available to additional families through Early Intervention and the Health Department). 2012 2013 LC OSF 51% 41% LC Non-OSF 16% 17% Out-of-County 31% 36% No Medical Home 2% 6% 1 April 30, 2014 Medical Home of Livingston County Preschoolers 6% 41% Livingston County OSF 41% Livingston County Non-OSF 17% 36% Out-of-County 36% No Medical Home 6% 17% B. Increase transition & collaboration between providers Three things have been done that have helped us meet our objective, to increase transition and collaboration between providers. The LCCN has developed a set of universal LCCN forms as well as flow-charts that have facilitated a much more seamless journey across and through the system of care. “Case manager” positions in each of the sectors utilize these forms and monitor the effectiveness of the communication protocols between providers. For the highest-need families, the CIA meets face-to-face to develop cohesive and coordinated treatment plans for all children in a given household. At the start of the grant, it was suspected that distribution of providers’ time might shift as the plan was implemented. In November 2011, we chose to look closely at one sector; the LCSSU school psychologists and school social workers were asked to log their time for two weeks to establish a baseline measure of time spent across various duties in their job descriptions. We anticipated that time spent in consultation with school personnel would increase as they provided support to teachers around Tier I and consultation with parents, medical providers, and mental health therapists would increase as the system of care became more seamless. We were completely taken by surprise by the number of hours that social workers were spending in communication with medical providers, an average of 2-3 hours each per week, in an effort to remove barriers to learning. Social workers were even, on occasion, authorized by parents to take children to medical appointments. Examples include securing treatment for severe eczema, inhaler for asthma, eye glasses, pain associated with decaying teeth, side-effects associated with psychotropic medication. This communication with the medical home is only possible if the social worker can secure a signed release of information. We are considering whether or not to ask parents to sign a release at school registration. C. Utilize data to evaluate process & outcome Early in the planning process, the community determined that there would never be enough resources to serve all children with mental health concerns in the county if we continued with a 2 April 30, 2014 model that focused our energy on treating our highest need children. Rather, we needed a public health approach that provided all children 0-18 with supports commensurate with their needs. At Tier I, we implemented strategies that would promote the well-being of children and families. Subsequent to universal screening, we utilized Tier II evidence-based strategies to support children and parents so that they could get back on track. For children who had already developed disorders, we provided Tier III, individual therapy, in accessible venues. And finally, for our highest need situations, children and their families are receiving intensive and frequent supports from multiple agencies to restore the family system to health. We have a graphic of a triangle which should fit nicely over the four levels of treatment such that most children (85%) need only our Tier I. Perhaps as many as 10% might fall in the at-risk or Tier II level, leaving only about 5% of children in Tiers III & IV. Mid-way through the launch of these services, we have more of an hour-glass design. In other words, while we are effectively serving most of the children in our Tier I, we also already have a large percentage of children who have pretty significant mental health needs. Over time, we are monitoring the distribution of children at each level of need and are gauging our success by shifting the balance to more children served in Tier I and Tier II and fewer children requiring individual therapy or intensive family systems interventions. Generally speaking, we are trying to evaluate both the process and the outcome of each change in our system of care. In year one, as part of a doctoral dissertation, we explored several aspects associated with implementation in the schools. Elementary schools were invited to participate in three different pieces of LCCN implementation: Positive Action, universal BESS screening, and an evidence-based Tier II small group intervention for children with positive screens. Of the 13 eligible schools, four schools chose no additional supports, four schools implemented one component, two schools implemented three components, and three schools implemented all three. Statistics were run on a number of variables to determine whether or not they had an impact on a school’s choice to participate. The only school-level characteristic that was strongly and significantly positively correlated with that decision was average class size. Schools with larger classes were more likely to implement more prevention components. Schools that served student populations with higher needs, as indicated by lower instructional expenditure, higher percent low income, higher mobility rate, and higher student: teacher ratios, demonstrated weak to moderate relationships with the number of prevention components implemented; however, these relationships were not found to be statistically significant. Furthermore, schools with a greater percentage of students with elevated scores on the screening measure were not more likely to implement more components as was hypothesized. Other interesting statistically significant findings were that schools with low income students experienced higher rates of mobility and truancy, and schools with higher mobility rates had more children receiving special education services. A second area studied in year one was treatment integrity associated with the Tier II curriculum, Strong Start, which was delivered by school psychologists and school social workers. Treatment integrity varied widely from 52-89% across the seven practitioner groups. The first threat to treatment integrity was that the lessons were designed to be 45 minutes in length so they were adapted to accommodate the shortened time allotments for the group, which were an average of 24-35 minutes. Some practitioners simply didn’t stick to the script and integrated other activities from other curricula. Others found that behavior management difficulties arose when small groups of children with positive screens were formed. The end result was that the average student receiving the curriculum received only slightly over half the time recommended. Nonetheless, while there were no gains evident on the BESS screener or a measure of emotion knowledge, there were statistically positive gains on AIMSweb early literacy scores for treatment adherence and treatment dosage. In other words, if practitioners used the curriculum as it 3 April 30, 2014 was intended, children experienced reading gains, AND the more of the curriculum the children received, the greater the impact on their reading scores. This local data provides strong support, consistent with research in the literature, that social-emotional interventions often have an astounding impact on academic performance. Similar to the processes encouraged in the schools, IHR has an interest in more closely monitoring child and adolescent therapy outcomes. Each quarter, the clinical director reports on the number of children whose progress is being monitored on the Ohio Scales; this measure was required by DHS at the start of the grant and thus we originally chose not to add another. However, we are considering adding a measure of the therapeutic alliance because this is of great interest to the Executive Director of IHR as a predictor for outcomes. We plan to utilize technology beginning in the latter part of Tier III to administer the Pediatric Symptom Checklist at 90 day intervals. We have consistently tried to promote the practice of systematically monitoring client progress. In year four, by utilizing tablets, the practitioners will not only be able to regularly graph client gains, but they will be able to immediately share this information with clients which, research suggests, can be very therapeutic. Over time, we will be able to look at patterns in the data which can guide allocation of community resources to certain types of training or treatment modalities. We are planning to compare publicly-reported county data every few years and a new report will be compiled by the Health Department soon. This report, however, summarizes the data that is being collected quarterly or annually. It is shared with the Leadership Team and has been the impetus for many course adjustments as described throughout this report. There are several types of data that each sector has identified for monitoring. Many of these are variables that are not likely to have had noticeable changes so far but will be part of the long-range progress monitoring of the children’s mental health system of care. CRISIS CALLS & PSYCHIATRIC HOSPITAL ADMISSIONS (0-18 yr olds) Crisis Calls and SASS Screens have held fairly steady over the last two years with a jump in actual hospitalizations in year two. The LCCN is designed to proactively and comprehensively address the needs of our youth so that fewer require these intensive services over time. These data represent incidents rather than individuals. 2012 2013 Crisis Calls 46 45 SASS Screens 83 89 Psychiatric Hospital Admissions 33 42 EMERGENCY DEPARTMENT VISITS Both the number of overall visits to the Emergency Room increased from years one to two. The hope is that children and adolescents health and mental health needs will be addressed in a more preventative fashion such that these numbers decrease over time. These data represent incidents rather than individuals. 2012 2013 MH-related Visits 45 78 Total Visits 2273 2854 GRADUATION RATES 4 April 30, 2014 Overall, the county’s high school graduation rate for four years is approximately 85%. For students requiring an additional year to accrue the necessary credits, the graduation rate is also right around 85%. 2012 2013 Dwight 4-yr 92 79 5-yr 84 92 Flanagan-Cornell 4-yr 83 93 5-yr 92 83 Pontiac 4-yr 87 82 5-yr 82 88 Prairie Central 4-yr 80 90 5-yr 80 83 Tri-Point 4-yr 69 83 5-yr 80 74 Woodland 4-yr 86 84 5-yr 90 86 JUVENILE POLICE REPORTS A review of juvenile police reports shows a slow but steady drop since the first year of the grant. It is hoped that these data actually reflect a decrease in law-breaking behaviors as a result of our prevention and early intervention strategies. 2011 448 2012 413 2013 401 2014 *104 through 4-28-14 (Compared to 128 during the same time period in 2013) Juvenile Police Reports 500 450 400 350 300 250 200 448 413 Juvenile Police Reports 401 150 100 104* 50 0 2011 2012 2013 2014 *Compared to 128 during the same time period (January-April) in 2013 5 April 30, 2014 6


