Supplementary Material
advertisement
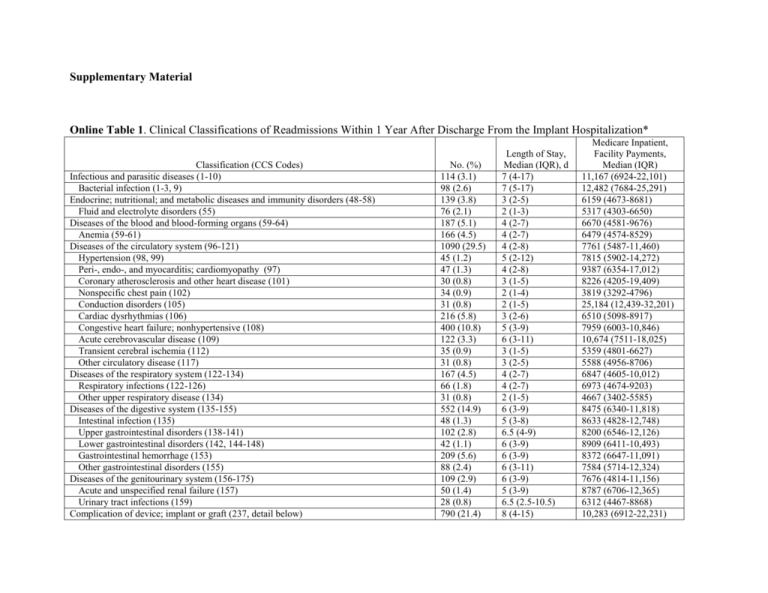
Supplementary Material Online Table 1. Clinical Classifications of Readmissions Within 1 Year After Discharge From the Implant Hospitalization* Classification (CCS Codes) Infectious and parasitic diseases (1-10) Bacterial infection (1-3, 9) Endocrine; nutritional; and metabolic diseases and immunity disorders (48-58) Fluid and electrolyte disorders (55) Diseases of the blood and blood-forming organs (59-64) Anemia (59-61) Diseases of the circulatory system (96-121) Hypertension (98, 99) Peri-, endo-, and myocarditis; cardiomyopathy (97) Coronary atherosclerosis and other heart disease (101) Nonspecific chest pain (102) Conduction disorders (105) Cardiac dysrhythmias (106) Congestive heart failure; nonhypertensive (108) Acute cerebrovascular disease (109) Transient cerebral ischemia (112) Other circulatory disease (117) Diseases of the respiratory system (122-134) Respiratory infections (122-126) Other upper respiratory disease (134) Diseases of the digestive system (135-155) Intestinal infection (135) Upper gastrointestinal disorders (138-141) Lower gastrointestinal disorders (142, 144-148) Gastrointestinal hemorrhage (153) Other gastrointestinal disorders (155) Diseases of the genitourinary system (156-175) Acute and unspecified renal failure (157) Urinary tract infections (159) Complication of device; implant or graft (237, detail below) No. (%) 114 (3.1) 98 (2.6) 139 (3.8) 76 (2.1) 187 (5.1) 166 (4.5) 1090 (29.5) 45 (1.2) 47 (1.3) 30 (0.8) 34 (0.9) 31 (0.8) 216 (5.8) 400 (10.8) 122 (3.3) 35 (0.9) 31 (0.8) 167 (4.5) 66 (1.8) 31 (0.8) 552 (14.9) 48 (1.3) 102 (2.8) 42 (1.1) 209 (5.6) 88 (2.4) 109 (2.9) 50 (1.4) 28 (0.8) 790 (21.4) Length of Stay, Median (IQR), d 7 (4-17) 7 (5-17) 3 (2-5) 2 (1-3) 4 (2-7) 4 (2-7) 4 (2-8) 5 (2-12) 4 (2-8) 3 (1-5) 2 (1-4) 2 (1-5) 3 (2-6) 5 (3-9) 6 (3-11) 3 (1-5) 3 (2-5) 4 (2-7) 4 (2-7) 2 (1-5) 6 (3-9) 5 (3-8) 6.5 (4-9) 6 (3-9) 6 (3-9) 6 (3-11) 6 (3-9) 5 (3-9) 6.5 (2.5-10.5) 8 (4-15) Medicare Inpatient, Facility Payments, Median (IQR) 11,167 (6924-22,101) 12,482 (7684-25,291) 6159 (4673-8681) 5317 (4303-6650) 6670 (4581-9676) 6479 (4574-8529) 7761 (5487-11,460) 7815 (5902-14,272) 9387 (6354-17,012) 8226 (4205-19,409) 3819 (3292-4796) 25,184 (12,439-32,201) 6510 (5098-8917) 7959 (6003-10,846) 10,674 (7511-18,025) 5359 (4801-6627) 5588 (4956-8706) 6847 (4605-10,012) 6973 (4674-9203) 4667 (3402-5585) 8475 (6340-11,818) 8633 (4828-12,748) 8200 (6546-12,126) 8909 (6411-10,493) 8372 (6647-11,091) 7584 (5714-12,324) 7676 (4814-11,156) 8787 (6706-12,365) 6312 (4467-8868) 10,283 (6912-22,231) Medicare Inpatient, Length of Stay, Facility Payments, Classification (CCS Codes) No. (%) Median (IQR), d Median (IQR) Malfunction of device; implant; and graft 183 (4.9) 6 (2-11) 11,010 (6896-72,037) Infection and inflammation--internal prosthetic device; implant; and graft 464 (12.5) 9 (5-15.5) 10,074 (7059-17,264) Other complications of internal prosthetic device; implant; and graft 136 (3.7) 8 (3-16) 10,482 (6293-34,307) Complications of surgical procedures or medical care (238, detail below) 110 (3.0) 5 (3-9) 9087 (6131-15,854) Hemorrhage or hematoma complicating a procedure 27 (0.7) 5 (3-8) 7356 (3245-13,880) Postoperative infection 53 (1.4) 6 (4-14) 10,834 (7202-20,308) Symptoms; signs; and ill-defined conditions and factors influencing health status (245-258) 132 (3.6) 3 (2-5) 5822 (4683-7249) Residual codes; unclassified; all E codes (259, 260) 74 (2.0) 3 (2-5) 5241 (4108-6637) * There were 3700 hospitalizations in this year of follow-up. Only categories with sufficient volume are shown. Source: HCUP Clinical Classifications Software (CCS) for ICD-9-CM. Healthcare Cost and Utilization Project (HCUP). 2006-2011. Agency for Healthcare Research and Quality, Rockville, MD. http://www.hcup-us.ahrq.gov/toolssoftware/ccs/ccsfactsheet.jsp. Accessed November 11, 2013. † Values are expressed in 2009 US dollars. Online Table 2. Implants per Site by Implant Year Annual Implants per Site Mean (SD) Median (interquartile range) Range Categories, No. (%) Low (1-3) Medium (4-8) High (≥ 9) 2006 (n = 64 sites) 3.0 (2.6) 2 (1-4) 1-13 2007 (n = 67 sites) 3.6 (3.1) 3 (2-5) 1-13 2008 (n = 74 sites) 4.2 (3.7) 3 (1-5) 1-21 2009 (n = 89 sites) 5.2 (4.7) 3 (2-8) 1-23 2010 (n = 102 sites) 6.7 (5.7) 5 (2-9) 1-26 2011 (n = 103 sites) 6.0 (4.4) 5 (3-8) 1-19 47 (73.4) 13 (20.3) 4 (6.3) 43 (64.2) 18 (26.9) 6 (9.0) 40 (54.1) 26 (35.1) 8 (10.8) 48 (53.9) 26 (29.2) 15 (16.9) 39 (38.2) 32 (31.4) 31 (30.4) 35 (34.0) 44 (42.7) 24 (23.3) Online Figure. Cumulative Incidence Curves for All-Cause Mortality by Implant Year
