Table S2. Distribution of individual variables that contributed to the
advertisement
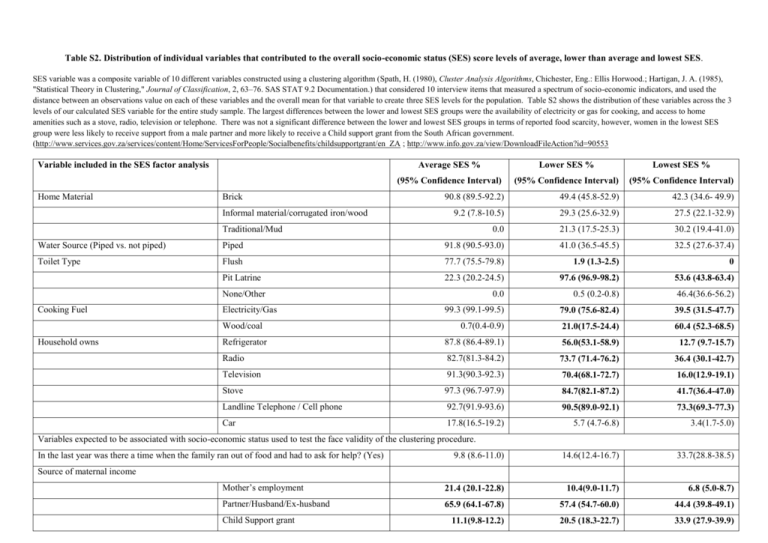
Table S2. Distribution of individual variables that contributed to the overall socio-economic status (SES) score levels of average, lower than average and lowest SES. SES variable was a composite variable of 10 different variables constructed using a clustering algorithm (Spath, H. (1980), Cluster Analysis Algorithms, Chichester, Eng.: Ellis Horwood.; Hartigan, J. A. (1985), "Statistical Theory in Clustering," Journal of Classification, 2, 63–76. SAS STAT 9.2 Documentation.) that considered 10 interview items that measured a spectrum of socio-economic indicators, and used the distance between an observations value on each of these variables and the overall mean for that variable to create three SES levels for the population. Table S2 shows the distribution of these variables across the 3 levels of our calculated SES variable for the entire study sample. The largest differences between the lower and lowest SES groups were the availability of electricity or gas for cooking, and access to home amenities such as a stove, radio, television or telephone. There was not a significant difference between the lower and lowest SES groups in terms of reported food scarcity, however, women in the lowest SES group were less likely to receive support from a male partner and more likely to receive a Child support grant from the South African government. (http://www.services.gov.za/services/content/Home/ServicesForPeople/Socialbenefits/childsupportgrant/en_ZA ; http://www.info.gov.za/view/DownloadFileAction?id=90553 Variable included in the SES factor analysis Home Material Brick Informal material/corrugated iron/wood Average SES % Lower SES % Lowest SES % (95% Confidence Interval) (95% Confidence Interval) (95% Confidence Interval) 90.8 (89.5-92.2) 49.4 (45.8-52.9) 42.3 (34.6- 49.9) 9.2 (7.8-10.5) 29.3 (25.6-32.9) 27.5 (22.1-32.9) 0.0 21.3 (17.5-25.3) 30.2 (19.4-41.0) Traditional/Mud Water Source (Piped vs. not piped) Piped 91.8 (90.5-93.0) 41.0 (36.5-45.5) 32.5 (27.6-37.4) Toilet Type Flush 77.7 (75.5-79.8) 1.9 (1.3-2.5) 0 Pit Latrine 22.3 (20.2-24.5) 97.6 (96.9-98.2) 53.6 (43.8-63.4) 0.0 0.5 (0.2-0.8) 46.4(36.6-56.2) 99.3 (99.1-99.5) 79.0 (75.6-82.4) 39.5 (31.5-47.7) 0.7(0.4-0.9) 21.0(17.5-24.4) 60.4 (52.3-68.5) Refrigerator 87.8 (86.4-89.1) 56.0(53.1-58.9) 12.7 (9.7-15.7) Radio 82.7(81.3-84.2) 73.7 (71.4-76.2) 36.4 (30.1-42.7) Television 91.3(90.3-92.3) 70.4(68.1-72.7) 16.0(12.9-19.1) Stove 97.3 (96.7-97.9) 84.7(82.1-87.2) 41.7(36.4-47.0) Landline Telephone / Cell phone 92.7(91.9-93.6) 90.5(89.0-92.1) 73.3(69.3-77.3) Car 17.8(16.5-19.2) 5.7 (4.7-6.8) 3.4(1.7-5.0) 9.8 (8.6-11.0) 14.6(12.4-16.7) 33.7(28.8-38.5) Mother’s employment 21.4 (20.1-22.8) 10.4(9.0-11.7) 6.8 (5.0-8.7) Partner/Husband/Ex-husband 65.9 (64.1-67.8) 57.4 (54.7-60.0) 44.4 (39.8-49.1) 11.1(9.8-12.2) 20.5 (18.3-22.7) 33.9 (27.9-39.9) None/Other Cooking Fuel Electricity/Gas Wood/coal Household owns Variables expected to be associated with socio-economic status used to test the face validity of the clustering procedure. In the last year was there a time when the family ran out of food and had to ask for help? (Yes) Source of maternal income Child Support grant

