Extreme Runoff Simulation in Mala Svinka Basin
advertisement
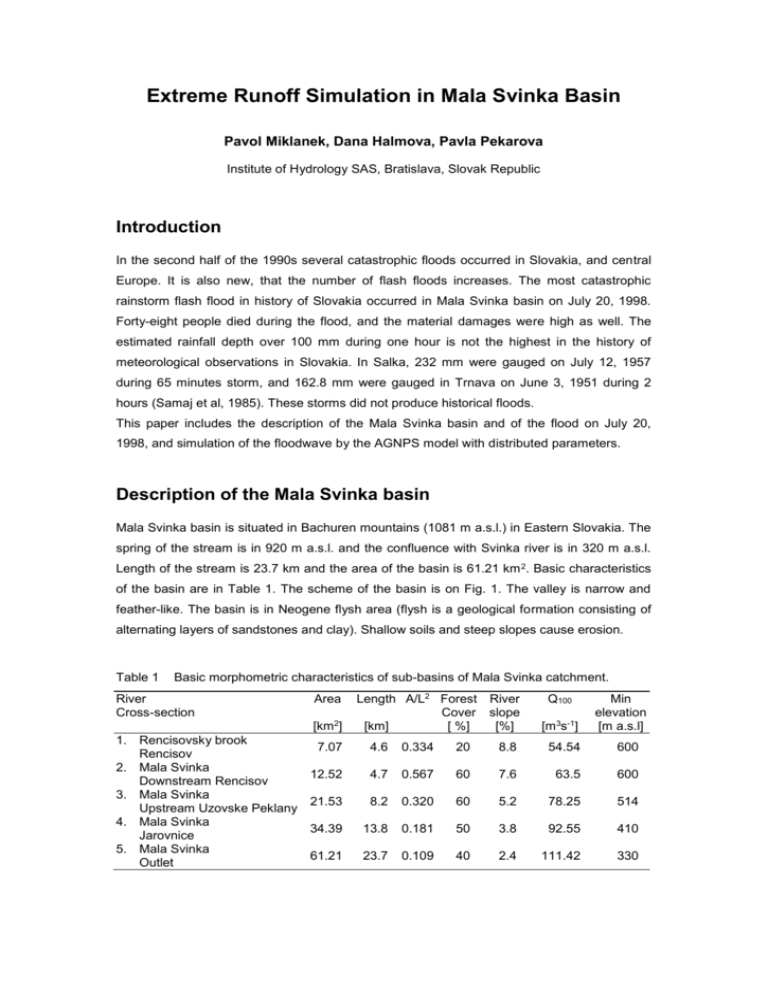
Extreme Runoff Simulation in Mala Svinka Basin Pavol Miklanek, Dana Halmova, Pavla Pekarova Institute of Hydrology SAS, Bratislava, Slovak Republic Introduction In the second half of the 1990s several catastrophic floods occurred in Slovakia, and central Europe. It is also new, that the number of flash floods increases. The most catastrophic rainstorm flash flood in history of Slovakia occurred in Mala Svinka basin on July 20, 1998. Forty-eight people died during the flood, and the material damages were high as well. The estimated rainfall depth over 100 mm during one hour is not the highest in the history of meteorological observations in Slovakia. In Salka, 232 mm were gauged on July 12, 1957 during 65 minutes storm, and 162.8 mm were gauged in Trnava on June 3, 1951 during 2 hours (Samaj et al, 1985). These storms did not produce historical floods. This paper includes the description of the Mala Svinka basin and of the flood on July 20, 1998, and simulation of the floodwave by the AGNPS model with distributed parameters. Description of the Mala Svinka basin Mala Svinka basin is situated in Bachuren mountains (1081 m a.s.l.) in Eastern Slovakia. The spring of the stream is in 920 m a.s.l. and the confluence with Svinka river is in 320 m a.s.l. Length of the stream is 23.7 km and the area of the basin is 61.21 km 2. Basic characteristics of the basin are in Table 1. The scheme of the basin is on Fig. 1. The valley is narrow and feather-like. The basin is in Neogene flysh area (flysh is a geological formation consisting of alternating layers of sandstones and clay). Shallow soils and steep slopes cause erosion. Table 1 Basic morphometric characteristics of sub-basins of Mala Svinka catchment. River Cross-section Area [km2] 1. Rencisovsky brook Rencisov 2. Mala Svinka Downstream Rencisov 3. Mala Svinka Upstream Uzovske Peklany 4. Mala Svinka Jarovnice 5. Mala Svinka Outlet Length A/L2 Forest River Cover slope [km] [ %] [%] Q100 [m3s-1] Min elevation [m a.s.l] 7.07 4.6 0.334 20 8.8 54.54 600 12.52 4.7 0.567 60 7.6 63.5 600 21.53 8.2 0.320 60 5.2 78.25 514 34.39 13.8 0.181 50 3.8 92.55 410 61.21 23.7 0.109 40 2.4 111.42 330 Results of the simulation The hydrological part of the AGNPS model (AGricultural Non-Point Source Pollution Model) was used to simulate the peak flows and runoff depths in Mala Svinka basin. The AGNPS is a geographically oriented model. It models the floodwave, and both water and material flows during a single rainfall-runoff event. The main input is precipitation depth and duration and output is peak runoff. Model can be used for simulation of different runoff situations (dry and wet conditions depending on antecedent precipitation). The land-use changes or farming practices can be simulated as well (particularly important for the chemical part of the model). Details are in the manual of the model by Young et al (1996). LEGEND 1. Renčiš. brook - Renčišov 2. M. Svinka - downstream of Renčišovský brook 3. Malá Svinka - upstream of Uzovské Pekľany 4. M. Svinka - Jarovnice 5. M. Svinka - outlet 60 mm 100 mm precipitation station M. Svin ka 3 1 Bachureň 1081 m Renčišov Renčiš . b. 2 M d in ž. b. Lipovce 62 mm Uzovské Pekľany 4 Jarovnice S M. A RI ST AU 48 POLAND CZECH REPUBLIC SL O K VA 5 km IA a 49 k vin 50 N UKRAINE HUNGARY 5 47 16 Fig. 1 18 20 22 24 E of G [degre] Kojatice Mala Svinka basin, rainfall depth on July 20, 1998. Rainfall The mean rain gauge density is about 1 gauge per 70 km 2 in Slovakia. Unfortunately, there is no rain gauge in Mala Svinka basin. Eight rain gauge stations are situated around the basin. The nearest station is in Lipovce, about 5 km far from the watershed. The rainfall depth was “only“ 62 mm in Lipovce during the day of the flood (Fasko & Lexmann, 1998). Major runoff depths were measured in Lipovce several times before: 81 mm on July 25, 1965 during the afternoon, 70 mm on July 13, 1973, and 93 mm on August 4, 1997 between 6 p.m. and 7 p.m. The highest daily rainfall in the neighbouring basins was 97.4 mm and it was gauged on June 29, 1958 in Brezovica nad Torysou. No significant flood was produced by these extreme rainfalls. Fasko & Lexmann (1998) noticed that the rainfall depth 62 mm in Lipovce represents 10years rainfall depth. They estimated that the rainfall depth over 100 mm occurres with the probability of 200 years. Samaj et al (1985) estimated the N-years maximum daily rainfall depths in Brezovica nad Torysou station (Table 2). The rainfall depths and intensities over the upper part of the basin were significantly higher and they were estimated by the meteorological and radar observations as 100 mm/h, or more than 100 mm depth. The duration of the storm was just about 1 hour. The approximate isohyets are on Fig. 1 (according Fasko and Lexmann, 1998). Table 2 N-years maximum daily precipitation in Brezovica nad Torysou and Lipovce Station – Years Brezovica nad Torysou Lipovce 2 5 10 20 30 50 80 90 100 200 37.8 51.6 60.5 69.7 74.9 81.1 87.0 88.6 90.0 98.3 62 >100 Simulation of the event by AGNPS model The flood event was simulated by AGNPS model separately in two versions: I. in the whole basin; and II. in the upper part of the basin. The simulation results in four profiles (see Fig. 1) are in Table 3: Profile 1. Profile 2. Profile 3. Profile 5. Rencisov brook in Rencisov; Mala Svinka downstream Rencisov; Mala Svinka upstream Uzovske Peklany; Mala Svinka - outlet. With respect to the rainfall depths estimated for the flood event by the Slovak Hydrometeorological Institute, the simulations were done for the rainfall depths between 70 and 120 mm. The results are in Table 3. Conclusion Mala Svinka basin is an ungauged basin, therefore the floodwave and the peak flows were estimated indirectly and post event by several authors. Svoboda and Pekarova (1998) simulated the peak flows with different models (also AGNPS) with good coincidence with estimated flow. The intention of this paper is to simulate hypothetical floods in this basin at different rainfalls. The reliability of the model was tested by simulations with divers density of grid cells (1 km and 500 m). The differences were negligible and grid area under 1 km 2 did not influence the results. Table 3 Simulated peak flows Q, yields qmax, floodwave volumes V and runoff depth R in selected profiles. Simulations were done I. in the whole basin, and II. in the upper part of the basin and rainfall ZR between 70 and 120 mm. Area ZR 70 80 90 100 110 120 Q qmax V R Q qmax V R Q qmax V R Q qmax V R Q qmax V R Q qmax V R m3s-1 m3s-1km-2 103 m3 mm m3s-1 m3s-1km-2 103 m3 mm m3s-1 3 m s-1km-2 103 m3 mm m3s-1 m3s-1km-2 103 m3 mm m3s-1 3 m s-1km-2 103 m3 mm m3s-1 m3s-1km-2 103 m3 mm Profile 1 6.7 km2 I. II. 59 57 8.8 8.5 382 328 54 49 68 67 10.1 9.9 450 391 64 58 78 76 11.6 11.3 519 448 73 67 88 88 13.1 13.2 589 528 83 79 97 98 14.5 14.6 658 591 93 88 107 107 16.0 15.9 739 647 105 97 Profile 2 12.52 km2 I. II. 92 79 7.4 6.3 696 598 56 48 107 93 8.5 7.4 820 712 66 57 122 106 9.7 8.5 942 814 75 65 137 124 10.9 9.9 1065 966 85 77 152 138 12.1 11.0 1186 1081 95 86 167 150 13.3 12.0 1288 1186 103 95 Profile 3 21.53 km2 I. II. 124 100 5.8 4.6 1197 957 53 44 145 119 6.7 5.5 1413 1149 63 53 166 136 7.7 6.3 1631 1324 72 61 188 161 8.7 7.5 1848 1575 82 73 209 180 9.7 8.3 2071 1772 92 82 230 197 10.7 9.1 2289 1947 102 90 Profile 5 61.21 km2 I. II. 222 3.6 3250 53 261 4.3 3856 63 300 4.9 4444 73 339 5.5 5056 83 377 6.2 5644 92 416 6.8 6231 102 AGNPS model is, in our opinion, a good tool for estimation and analysis of the rainfall-runoff processes in the basin (particularly its graphical part). References FASKO, P. & LEXMANN, E.: (1998) The storm in Mala Svinka – the worst catastroph caused by storm in Slovakia. (In Slovak.) SME/Smena, 3.8.1998. SVOBODA A. & PEKAROVA, P. (1998) Catastrophic flood of July 1998 in the Mala Svinka catchment – its simulation. (In Slovak.) J. Hydrol. Hydromech., 46, 6, 353-371. SAMAJ, F., VALOVIC, S. & BRAZDIL, R. (1985) Daily totals of precipitation with extreme intensity in Czechoslovakia during the period 1901-1980. (In Slovak.) Collection of papers of the SHMI 24, Bratislava, 9-112. YOUNG, R.A.–ONSTAD, Ch.A.–BOSCH, D.–ANDERSON, W. P. (1996) Agricultural NonPoint Source Pollution Model, Version 4.03. User´s guide. MPCA, Minnesota. Acknowledgement: The paper was prepared with support of the VEGA grant 6008.
