Theoretical studies on structural properties and reactivity of two
advertisement

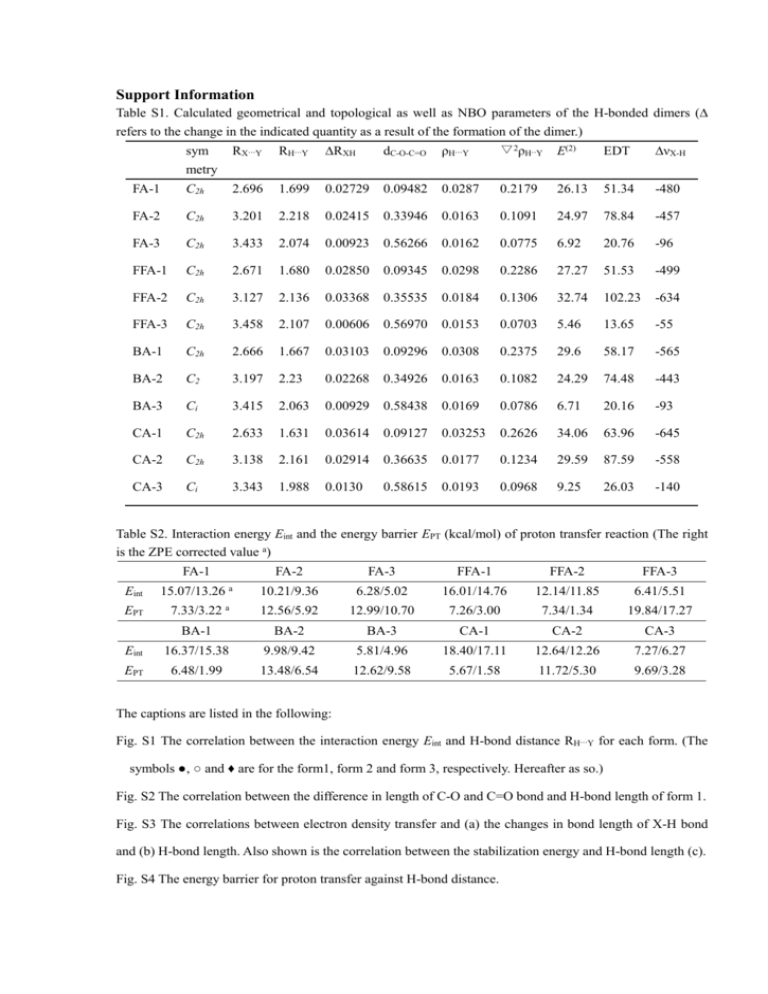
Support Information Table S1. Calculated geometrical and topological as well as NBO parameters of the H-bonded dimers (∆ refers to the change in the indicated quantity as a result of the formation of the dimer.) sym metry RX···Y RH···Y ∆RXH dC-O-C=O ρH···Y ▽2ρH··Y E(2) EDT ∆νX-H FA-1 C2h 2.696 1.699 0.02729 0.09482 0.0287 0.2179 26.13 51.34 -480 FA-2 C2h 3.201 2.218 0.02415 0.33946 0.0163 0.1091 24.97 78.84 -457 FA-3 C2h 3.433 2.074 0.00923 0.56266 0.0162 0.0775 6.92 20.76 -96 FFA-1 C2h 2.671 1.680 0.02850 0.09345 0.0298 0.2286 27.27 51.53 -499 FFA-2 C2h 3.127 2.136 0.03368 0.35535 0.0184 0.1306 32.74 102.23 -634 FFA-3 C2h 3.458 2.107 0.00606 0.56970 0.0153 0.0703 5.46 13.65 -55 BA-1 C2h 2.666 1.667 0.03103 0.09296 0.0308 0.2375 29.6 58.17 -565 BA-2 C2 3.197 2.23 0.02268 0.34926 0.0163 0.1082 24.29 74.48 -443 BA-3 Ci 3.415 2.063 0.00929 0.58438 0.0169 0.0786 6.71 20.16 -93 CA-1 C2h 2.633 1.631 0.03614 0.09127 0.03253 0.2626 34.06 63.96 -645 CA-2 C2h 3.138 2.161 0.02914 0.36635 0.0177 0.1234 29.59 87.59 -558 CA-3 Ci 3.343 1.988 0.0130 0.58615 0.0193 0.0968 9.25 26.03 -140 Table S2. Interaction energy Eint and the energy barrier EPT (kcal/mol) of proton transfer reaction (The right is the ZPE corrected value a) FA-1 FA-2 FA-3 FFA-1 FFA-2 FFA-3 10.21/9.36 6.28/5.02 16.01/14.76 12.14/11.85 6.41/5.51 12.56/5.92 12.99/10.70 7.26/3.00 7.34/1.34 19.84/17.27 BA-1 BA-2 BA-3 CA-1 CA-2 CA-3 Eint 16.37/15.38 9.98/9.42 5.81/4.96 18.40/17.11 12.64/12.26 7.27/6.27 EPT 6.48/1.99 13.48/6.54 12.62/9.58 5.67/1.58 11.72/5.30 9.69/3.28 Eint EPT 15.07/13.26 a 7.33/3.22 a The captions are listed in the following: Fig. S1 The correlation between the interaction energy Eint and H-bond distance RH···Y for each form. (The symbols ●, ○ and ♦ are for the form1, form 2 and form 3, respectively. Hereafter as so.) Fig. S2 The correlation between the difference in length of C-O and C=O bond and H-bond length of form 1. Fig. S3 The correlations between electron density transfer and (a) the changes in bond length of X-H bond and (b) H-bond length. Also shown is the correlation between the stabilization energy and H-bond length (c). Fig. S4 The energy barrier for proton transfer against H-bond distance.


