for the water and nitrogen cycles
advertisement
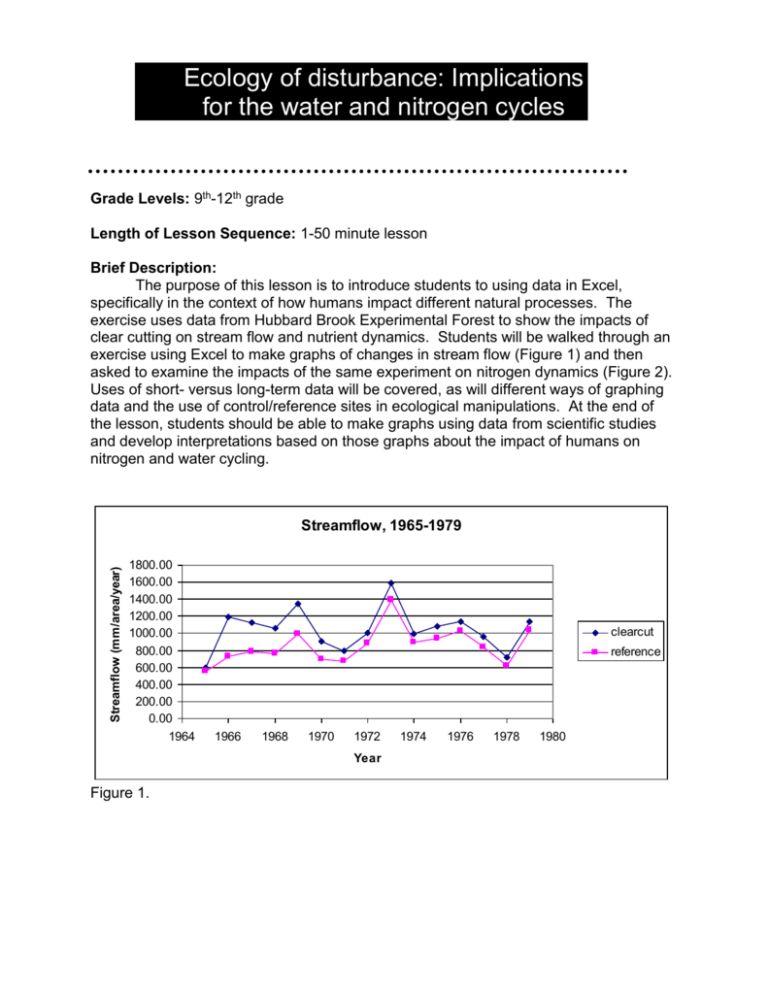
Ecology of disturbance: Implications for the water and nitrogen cycles Grade Levels: 9th-12th grade Length of Lesson Sequence: 1-50 minute lesson Brief Description: The purpose of this lesson is to introduce students to using data in Excel, specifically in the context of how humans impact different natural processes. The exercise uses data from Hubbard Brook Experimental Forest to show the impacts of clear cutting on stream flow and nutrient dynamics. Students will be walked through an exercise using Excel to make graphs of changes in stream flow (Figure 1) and then asked to examine the impacts of the same experiment on nitrogen dynamics (Figure 2). Uses of short- versus long-term data will be covered, as will different ways of graphing data and the use of control/reference sites in ecological manipulations. At the end of the lesson, students should be able to make graphs using data from scientific studies and develop interpretations based on those graphs about the impact of humans on nitrogen and water cycling. Streamflow (mm/area/year) Streamflow, 1965-1979 1800.00 1600.00 1400.00 1200.00 1000.00 800.00 600.00 400.00 200.00 0.00 1964 clearcut reference 1966 1968 1970 1972 Year Figure 1. 1974 1976 1978 1980 Nitrate concentration (mg/L) Nitrate Flux, 1965-1979 60.00 50.00 40.00 clearcut 30.00 reference 20.00 10.00 0.00 1964 1966 1968 1970 1972 1974 1976 1978 1980 Year Figure 2. Content Statements/Standards Covered: Standard B3: Interdependence of living systems and the environment L3.p4 Human Impact on Ecosystems (prerequisite) L3.p4A Recognize that, and describe how, human beings are part of Earth’s ecosystems. Note that human activities can deliberately or inadvertently alter the equilibrium in ecosystems. B3.3 Element Recombination B3.3b Describe environmental processes (e.g., the carbon and nitrogen cycles) and their role in processing matter crucial for sustaining life. B3.4 Changes in Ecosystems B3.4A Describe ecosystem stability. Understand that if a disaster such as a flood or fire occurs, the damaged ecosystem is likely to recover in stages of succession that eventually result in a system similar to the original one. B3.4C Examine the negative impact of human activities Objectives of Lesson: At the conclusion of the lesson, students will be able to: Graph data in Microsoft Excel Understand the importance of ecosystem-scale experiments Look for patterns in long-term datasets from scientific studies Interpret these patterns based on previous knowledge of the nitrogen cycle Understand the importance of long-term datasets (i.e. conclusions based on short-term versus long-term responses can be completely different) Understand the tight coupling of the nitrogen cycle in forested ecosystems Understand that human disturbance can alter the nitrogen cycle (i.e. accelerating the export of nitrate from this ecosystem study) Materials and Resources 1. computers with Microsoft Excel 2. computer with projector 3. internet access to download watershed data Strategy Inquiry cycles: finding and explaining patterns in data (arguments from evidence) - TOPE: techniques-observations-patterns-explanations Observations, patterns, and explanations Observations or experiences (examples, phenomena, data) Long-term Hubbard Brook watershed nitrate data Patterns (laws, generalizations, graphs, tables, categories) Develop graphs of watershed nitrate data Explanations (models, theories) Relate patterns back to conceptual model of nitrogen cycle Application: Model-based Reasoning Inquiry: Finding and Explaining Patterns in Experience Activities of the Session 5 minutes –introduction/anticipatory set: show students a picture of a clear-cut forest and ask students to discuss possible impacts to the watershed 5 minutes – introduction to the Hubbard Brook Experimental System and the small watershed concept 10 minutes – exploration of a stream flow dataset from Hubbard Brook, one fellow leading on projected computer, second one answering questions/troubleshooting throughout the classroom. 20 minutes – individual/partner exploration of the nitrogen data from Hubbard Brook, graphing data and discovering trends. Halfway through they will be given/directed to a data expansion that includes more years and asked to see if longer term data makes a difference. 10 minutes- wrap-up/concluding activities: discussion of the importance of scale, long term data & spatial, discussion of this as a demonstration of human impacts, discussion of relevant content standards. Depending on time, possible extensions to this exercise using related data that are available at the Hubbard Brook website (www.hubbardbrook.org). In addition, please see the MSU GK-12 website for additional graphing ideas with this same dataset. References Likens, G. E., F. H. Bormann , R. S. Pierce, and W. A. Reiners. 1978. Recovery of a deforested ecosystem. Science 199: 492-496. Likens, G. E., F. H. Bormann, N. M. Johnson, D. W. Fisher, and R. S. Pierce. 1970. Effects of forest cutting and herbicide treatment on nutrient budgets in the Hubbard Brook watershed-ecosystem. Ecological Monographs 40:23-47. Welman, A., C. Berger, M. Krasny and the Ecological Society of America. 2004. Hubbard Brook streamflow response to deforestation. Teaching Issues and Experiments in Ecology 1:1-13 (www.tiee.ecoed.net).
