PART 3 – ANALYSIS
Along with biological analysis, water chemistry analysis plays an important role in determining water
quality. Lack of key nutrients or excess of others can result in the degradation of the aquatic environment
and harm aquatic life. The areas to be considered in Part 3 are the following:
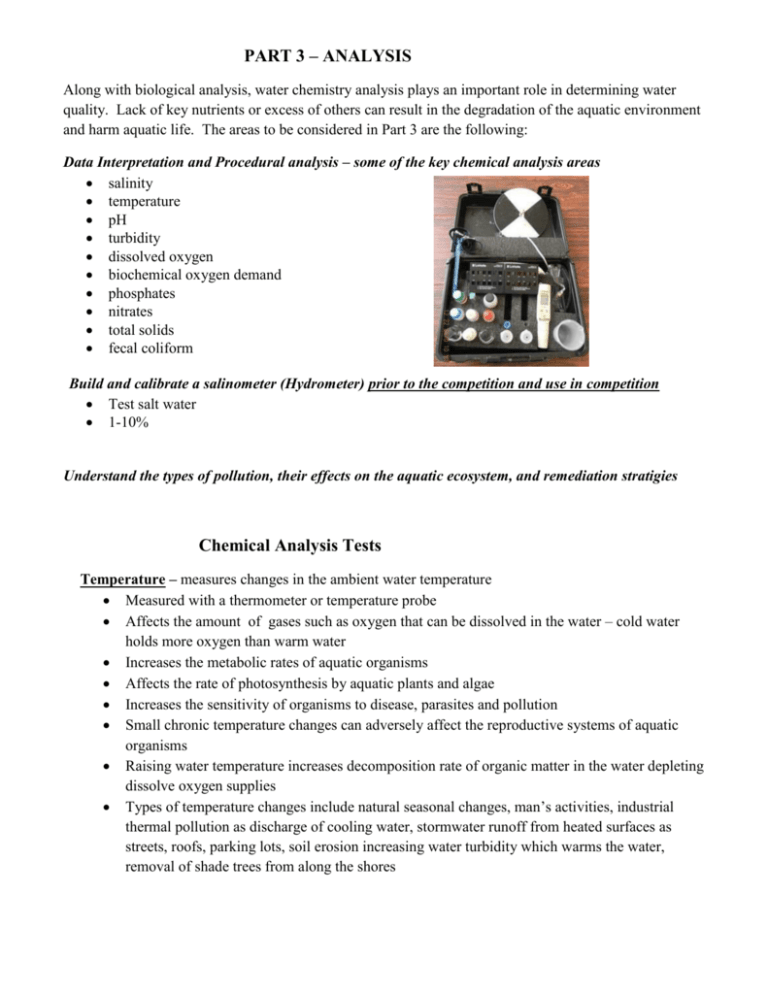
Data Interpretation and Procedural analysis – some of the key chemical analysis areas
salinity
temperature
pH
turbidity
dissolved oxygen
biochemical oxygen demand
phosphates
nitrates
total solids
fecal coliform
Build and calibrate a salinometer (Hydrometer) prior to the competition and use in competition
Test salt water
1-10%
Understand the types of pollution, their effects on the aquatic ecosystem, and remediation stratigies
Chemical Analysis Tests
Temperature – measures changes in the ambient water temperature
Measured with a thermometer or temperature probe
Affects the amount of gases such as oxygen that can be dissolved in the water – cold water
holds more oxygen than warm water
Increases the metabolic rates of aquatic organisms
Affects the rate of photosynthesis by aquatic plants and algae
Increases the sensitivity of organisms to disease, parasites and pollution
Small chronic temperature changes can adversely affect the reproductive systems of aquatic
organisms
Raising water temperature increases decomposition rate of organic matter in the water depleting
dissolve oxygen supplies
Types of temperature changes include natural seasonal changes, man’s activities, industrial
thermal pollution as discharge of cooling water, stormwater runoff from heated surfaces as
streets, roofs, parking lots, soil erosion increasing water turbidity which warms the water,
removal of shade trees from along the shores
pH – measures the hydrogen ion concentration of substances in a scale of 0 to 14
Measured with a pH meter, pH probe or pH paper
Water contains both hydrogen and hydroxyl ions
pH of 0 to 7 is acidic with 0 being the most acidic
pH of 7 is neutral – water containing equal numbers of hydrogen and hydroxyl
ions
pH of 7 to 14 is basic with 14 being the most basic
The pH scale is lograthmic – pH change of one points indicated a 10 fold
change
Water with a pH of four is ten times more acidic than water having a pH of five
Normal pH of rivers in the US is between 6.5 and 8.5
pH range of 6.0 to 9.0 appears to provide protection for the life of freshwater fish and bottom
dwelling invertebrates
Small changes in pH result in large changes in water chemistry
Extremely high or low pH levels (above 11.0 and below 4.5) become lethal for most organisms
In Basic water, ammonia compounds convert to a toxic form
Very Acid waters can cause heavy metals to be released and be accumulated in the food chain
Acid rain has a pH of less than 5 and will lowers the pH of bodies of water
The geology of the area affects water pH change – limestone neutralizes the effects of acid rain
Natural sources of acids include volcanoes, natural geysers, and hot springs
pH Ranges that Support Aquatic Life
Bacteria
1.0 to 13
Carp, catfish, some insects
6 to 9
Snails, Clams
7 to 9
Largest variety of animals plus mayfly, dragonfly nymph
6.5 to 7.5
Plants (algae, rooted, etc.)
6.5 to 12
Sunfish
6.5 to 8.5
As water pH
approaches
Effects
6.0
crustaceans, insects, and some plankton species begin to disappear.
major changes in the makeup of the plankton community occur.
less desirable species of mosses and plankton may begin to invade.
the progressive loss of some fish populations is likely, with the more
highly valued species being generally the least tolerant of acidity.
the water is largely devoid of fish.
the bottom is covered with undecayed material.
the nearshore areas may be dominated by mosses.
5.0
Less than 5.0
terrestrial animals, dependent on aquatic ecosystems, are affected. Waterfowl, for
example, depend on aquatic organisms for nourishment and nutrients. As these
food sources are reduced or eliminated, the quality of habitat declines and the
reproductive success of birds is affected.
Source: Environmental Canada: Acid Rain and Water
Turbidity – measures the clarity or haziness of the water in a given body of water
Clear water has low turbidity and cloudy or murky water has high turbidity
Cloudiness occurs from suspended sediment, algal blooms, or dead organic matter in the water
Turbidity id measured in nephelometric turbidity units (NTU’s) – a comparison of the amount
of light scattered by the suspended particles in the water
The turbidity affects the amount of light penetrating to the plants for photosynthesis
High particulate concentrations can affect the ability of fish gills to absorb oxygen
Contaminants as viruses and bacteria can become attached to particulate matter
The Secchi disk is used to measure turbidity in a lake
Black and white disk is lowered into the water until it can no longer be seen
Secchi disk depth is usually reported in feet to the nearest tenth of a foot, or meters to the
nearest tenth of a meter.
The rule of thumb is that light can penetrate to a depth of about 2 - 3 times the Secchi disk
depth.
Natural color of water may affect the reading
Seasonal variations may change the turbidity as with lake turnover in the fall due to nutrients
being released from the bottom
Algal blooms with affect turbidity
Pollution tends to reduce water clarity
Human activity as construction, agriculture, and land disturbances can lead to high sediment in
storm water runoff
Industries as mining can generate high levels of colloid rock particles
Dissolved Oxygen (DO) – measures the amount of gaseous oxygen dissolved in an aqueous solution
Oxygen gets into the water by diffusion from the surrounding air, as a waste product of
photosynthesis or by rapid movement of the water or aeration
Kits are available for testing DO levels
DO levels must be tested done carefully and
quickly because so many factors affect DO
Air is about 21% oxygen which is 210,000 ppm
(parts per million)
Most surface waters contain between 5 and 15 ppm
of dissolved oxygen
An appropriately high level of dissolved oxygen is
essential for aquatic life
Below 5 ppm puts aquatic life under stress, below
1-2 ppm for a few hours can kill large fish
Absence of dissolved oxygen is a key sign of severe pollution
DO Testing materials
Total dissolved oxygen levels should not exceed 110% - above this level can be harmful to
aquatic life
Many natural factors affect the levels of dissolved oxygen such as
o Seasonal temperature changes – lower temperature equals more dissolved oxygen
o Dissolved or suspended solids can reduce effectiveness dissolving of oxygen in water
o Dry periods can lower stream discharge and raise water temperatures resulting in lower
DO levels
o The amount of plant life affects photosynthesis rates – more photosynthesis equals more
oxygen being released by plants
o The rate of respiration by all plants and animals aerobically
o The rate of decomposition of organic matter uses oxygen so it greatly affects DO levels
o Daily changes – night to day or /diel oxygen fluctuation - cause DO to fluctuate because
plants need light for photosynthesis but respiration uses oxygen all through the 24 hr
period
o Algal blooms can cause large fluctuations in DO through the night especially in areas
where there is not much current for aeration
o Very low DO levels can cause aquatic animals to die
Humans can also cause changes
in DO by dumping organic waste
into water increasing rates of
decomposition in the water and
can increase aquatic plant growth
Urban runoff can bring
pollutants, sediment, heat and
other materials which raise water
temperatures and lowering DO
levels
The release of water from a dam
(top or bottom) release can affect
the amount of DO in the water
Removing shade vegetation as
trees can increase water
temperature and increase erosion
to reduce DO levels
Biochemical Oxygen Demand (BOD) – measures how fast organisms use up the oxygen in the water
Aerobic microbes use oxygen to oxidize the organic matter in the water
BOD is tested using the maters for testing dissolved oxygen but the test is done over a
period of time to determine the rate of oxygen being used
Natural sources of organic matter may include plant decay or leaf fall
Human waste as leaves, lawn clippings, paper waste, pet waste entering into the water can
accelerate plant growth and decay because nutrients and sunlight are overly abundant
These human wastes can increase oxygen demand
Oxygen used for decomposition processes rob other organisms of oxygen needed to live
Organisms with low tolerance may die off and be replaced by organisms with more
tolerance for low oxygen levels
Phosphates – measures the amount of phosphates in the water (the compound for phosphorus in the
water)
The phosphorus cycle recycles phosphorus in the form of phosphates for most life forms
Phosphorus is necessary for plant and animal growth
Test kits are available to test total phosphates
The total phosphorus test measures all the forms of phosphorus in the sample
(orthophosphate, condensed phosphate, and organic phosphate).
Phosphates enter waterway in a variety of natural ways such as phosphate containing rock
and normal animal and plant waste in the water
Phosphates will enter waterways from runoff
Phosphates enter waterway in a variety of human sources such as fertilizers, pesticides,
industrial and cleaning compounds, human and animal waste, power plant boilers (used to
prevent corrosion), septic tanks and wastewater from sewage treatment plants
Phosphates stimulate the growth of water plants and plankton
Limited increases in plant growth can provide more food for aquatic macroinvertebrates and
fish
Too much phosphate can cause excess algae and aquatic weeds using up large amounts of
oxygen and causing aquatic organisms and fish to die
Nitrates – measures the different forms of nitrogen in aquatic environments
Nitrogen is required for building proteins by all living plants and animals
Forms of inorganic nitrogen include ammonia (NH3), nitrates (NO3), and nitrites (NO2)
Usable forms of nitrogen for aquatic plant growth are ammonia (NH3) and nitrates (NO3)
Test kits and probes are for testing the forms on nitrogen
Nitrates stimulate the growth of plants and algae in the water allowing for more animal food
Excess amounts of nitrates can cause algae to bloom wildly reducing oxygen levels for fish
and sometimes causing their death (accelerated eutrophication)
Accelerated eutrophication from excess nitrogen and phosphorus can also affect water
temperature, dissolved oxygen and other key water quality indicators
As plants and animals die, bacteria break down the organic matter
Ammonia is oxidized to form nitrates and using up dissolved oxygen in the water
Nitrates get into waterways from farm fertilizer, poorly functioning septic tanks, inadequately
treated wastewater from sewage treatment plants, manure from farm livestock, animal wastes
including fish and birds, storm drains, runoff from crop fields, parks, lawns, feedlots and car
exhausts
Total Solids – measures the suspended and dissolved solids in water
Suspended solids can be retained on a water filter and will settle to the bottom of a water
column and include silt, clay, plankton, organic wastes, and inorganic precipitates
Dissolved solids pass through a water filter and include calcium, bicarbonate, nitrogen,
phosphorus, iron, and sulfur and other ions in the water
Concentration of dissolved solids in stream water is important because it determines the flow
of water in and out of the cells of aquatic organisms
Many of the dissolved solids as nitrogen, phosphorus, and sulfur are essential nutrients for life
Low concentrations of total solids can limit growth of aquatic organisms
Elevated levels can lead to accelerated eutrophication of the water system and increase the
turbitidy both of which decrease water quality
Sources of elevated levels of total solids may result as a result of runoff from agricultural
activities, dredging, mining, salt from streets in winter, fertilizers from lawns, water treatment
plants, plant materials, soil particles and soil erosion, and decaying organic matter
High concentrations of suspended solids can reduce water clarity, affect turbidity, reduce light
reaching plants and effecting photosynthesis, increase water temperature due to increased
absorption of light at the water surface and bind with toxic chemicals and/or heavy metals
Fecal Coliform – measures the amount of Fecal Coliform bacteria in the water
Fecal Coliform bacteria live in the intestines of warm-blooded animals
Fecal Coliform bacteria are also found in the feces excreted from humans and other warmblooded animals
Fecal Coliform bacteria are living organism entering the waterway
High numbers of Fecal Coliform in water means that the water has received fecal matter from
some source
Although Fecal Coliform bacteria are not necessarily agents of disease but they may indicate
the presence of disease causing microbes which live in the same environment
Fecal Coliform concentrations are reported in number of bacterial
colonies per 100 mL of sample water
When Fecal Coliform counts are over 200 colonies/100 mL of water
sample, there is a greater chance of pathogenic organisms being present
Diseases as dysentery, typhoid fever, gastroenteritis, hepatitis, and ear
infections are associated with waters having high Coliform counts
Primary sources of Fecal Coliform bacteria are failing septic systems,
correct when you have 20-80
animal waste, and water treatment plant discharges
evenly dispersed colonies
Urbanization can cause problems with storm and sanitary sewers, sewer
pipes, domestic plant wastes seeping into storm water runoff
Higher temperatures and high levels of nutrients increase the growth rate of bacteria
Salinity – measures the amount of salts in the water
High levels of salt can adversely affect plant growth and water quality
Sources of salt include seawater intrusion, human and animal wastes, industrial wastes,
fertilizers, and winter highway deicing (salt spread on streets in winter can soak into adjacent
soils and continue to leach into nearby waterways throughout the year)
Vertical salt seepage into shallow costal aquifers is causing many problems
Measuring the salt in a water sample by using a hydrometer/salinomter (water with more salt
is more dense and will float the hydrometer/salinometer at higher levels in the cylinder
depending upon the concentration of salt)
freshwater
saltwater
calibrating the salinometer
Making A Simple Salinometer
Materials
Water
Saltwater Solution
Several types of salinometers can be made. The simplest is a hydrometer calibrated to read
in % of salt concentration instead of specific gravity. Follow the instructions below to make
and calibrate a simple salinometer. You will need to research how to make a known saltwater
solution to use as a calibration standard.
Materials:
• soda straw
• modeling clay
• a fine-tipped permanent marker
• a tall clear container to hold the solution for calibrating your device
• salt for mixing one or more standard solutions
• water (tap water will work-distilled is better)
1. Mold a ball of modeling clay around one end of the straw. Make sure that the clay
prevents water from leaking into the straw. Try to avoid forming pits or voids in the
clay that can trap air.
2. Fill the container with water. Carefully insert the straw (clay covered end down) and
add/remove clay until the straw floats at the maximum depth you wish.
3. Use the permanent marker to mark the depth where the salinometer floats in the water
(0% salt solution).
4. Mix a saltwater solution of known concentration to use as a calibration standard.
(10% is a good choice!)
5. Place the salinometer in the calibration standard and mark the level where it floats.
6. Interpolate/extrapolate from the two marks you have made to add additional lines on
the scale. You can calibrate your device using additional standards at other
concentrations to improve its accuracy.
You are not limited to this simple salinometer. Use your library, the internet, or other
resources to research how to make a device with better accuracy and sensitivity.
Salinometer.doc
12/7/2004
Copyright 2004 Science Olympiad Inc - All rights reserved
Schools with a current membership in Science Olympiad may copy this information for use within their school.
Types of Water Pollution and their Effects
If water pollution is from a single source it is called point-source pollution while pollution coming
from many sources is called nonpoint pollution.
Type of Water
Pollution
Biodegradable
waste
Cause of
Pollution
Humans and
animals
Nutrients
Nitrates and
phosphates
Heat
Increased water
temperature
Sedimentation
Suspended
particles
settling out of
water
Toxic and
hazardous
chemicals
Chemicals
Radioactive
pollutants
Radioactive
isotopes
Medical
Medicines,
antibiotics
Symptoms of
Pollution
Decreasing
numbers of
fish and other
aquatic life,
increasing
number of
bacteria
Green,
cloudy,
slimy, stinky
water
Warmer
water, less
oxygen,
fewer aquatic
organisms
Cloudy water,
increased
amount of
bottom
Water colour
changes,
develops an
odour,
aquatic life
die out
Increased
rates of birth
defects and
cancer in
human and
animal
populations.
Infertility in
aquatic
organisms,
and other
unknown
symptoms
Source: Safe Water Drinking Foundation
Effect of Pollution
Source of Pollution
Increased number of
bacteria, decreased oxygen
levels, death of aquatic life
Run-off, improperly treated
effluent,
Algae blooms,
eutrophication of water
source
Over use of fertilizers, run-off
from fields, improper disposal of
containers, wastewater treatment
Decrease in oxygen levels,
death of fish and plants
Industrial run-off, wastewater
treatment
Warms up water, decreases
depth of water source,
deposits toxins
Construction sites, farming and
livestock operations, logging,
flooding, city run-off, dams
Kills aquatic life, can enter
human food chain, leads to
birth defects, infertility,
cancer and other diseases
in humans and animals
Human-made, improper disposal,
run-off, dams, landfill leachate,
industrial discharge, acid rain
Kills aquatic species and
leads to cancer and death
in humans and other
animals
Waste water discharges from
factories, hospitals and uranium
mines
Unknown
Humans dumping medicines into
water systems, wastewater
treatment
Remediation for Water Pollution
Involvement at many levels to prevent sources of pollution
individuals
communities
industries
states
federal governments
Stabilization of the ecosystem
significant remedy to control water pollution
the reduction in waste input
harvesting and removal of biomass
trapping of nutrients
fish management
aeration
Reutilization and recycling of water
industrial effluents (as paper pulp or other chemicals),
sewage of municipal and other systems
thermal pollutants (waste water etc.) may be recycled to beneficial use.
Removal of pollutants
Various pollutants (radioactive, chemical, biological) present in water body
Using appropriate methods or remedy like adsorption, electro-dialysis, ion-exchange, reverse
osmosis etc.

