Chapter 10 - - Capital Budgeting: Cash Flow Principles - Rose
advertisement
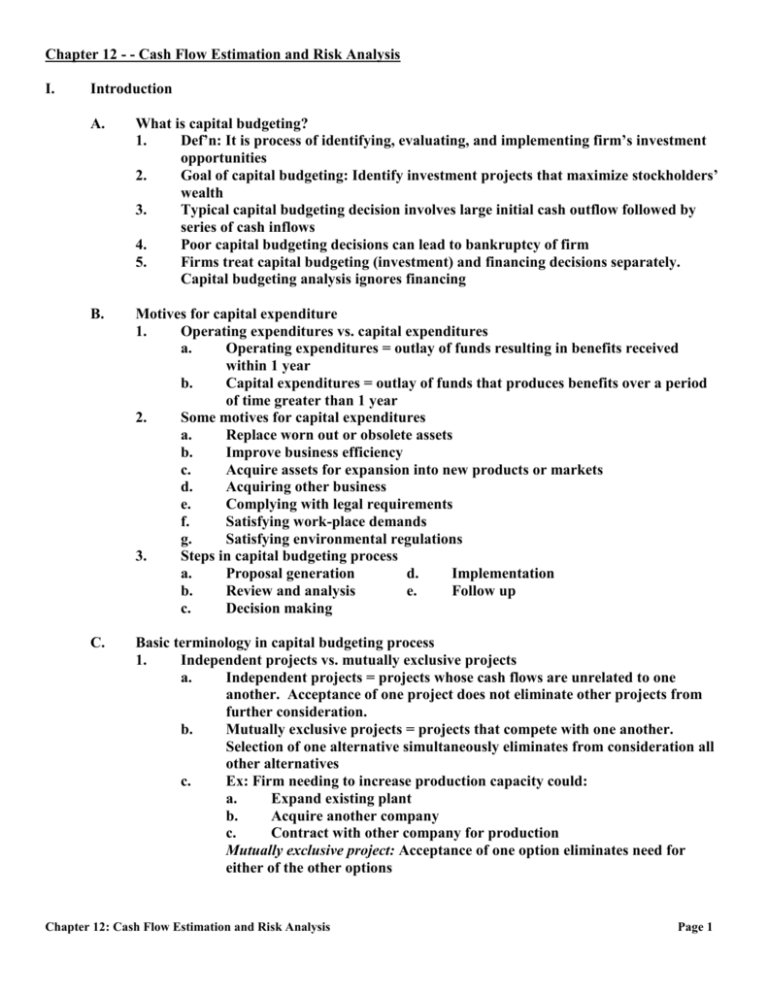
Chapter 12 - - Cash Flow Estimation and Risk Analysis I. Introduction A. What is capital budgeting? 1. Def’n: It is process of identifying, evaluating, and implementing firm’s investment opportunities 2. Goal of capital budgeting: Identify investment projects that maximize stockholders’ wealth 3. Typical capital budgeting decision involves large initial cash outflow followed by series of cash inflows 4. Poor capital budgeting decisions can lead to bankruptcy of firm 5. Firms treat capital budgeting (investment) and financing decisions separately. Capital budgeting analysis ignores financing B. Motives for capital expenditure 1. Operating expenditures vs. capital expenditures a. Operating expenditures = outlay of funds resulting in benefits received within 1 year b. Capital expenditures = outlay of funds that produces benefits over a period of time greater than 1 year 2. Some motives for capital expenditures a. Replace worn out or obsolete assets b. Improve business efficiency c. Acquire assets for expansion into new products or markets d. Acquiring other business e. Complying with legal requirements f. Satisfying work-place demands g. Satisfying environmental regulations 3. Steps in capital budgeting process a. Proposal generation d. Implementation b. Review and analysis e. Follow up c. Decision making C. Basic terminology in capital budgeting process 1. Independent projects vs. mutually exclusive projects a. Independent projects = projects whose cash flows are unrelated to one another. Acceptance of one project does not eliminate other projects from further consideration. b. Mutually exclusive projects = projects that compete with one another. Selection of one alternative simultaneously eliminates from consideration all other alternatives c. Ex: Firm needing to increase production capacity could: a. Expand existing plant b. Acquire another company c. Contract with other company for production Mutually exclusive project: Acceptance of one option eliminates need for either of the other options Chapter 12: Cash Flow Estimation and Risk Analysis Page 1 2. 3. 4. II. Unlimited funding vs. capital rationing a. Unlimited funding = financial situation in which firm is able to accept all independent projects that provide acceptable return b. capital rationing = financial situation in which firm has only limited number of dollars available for capital expenditure and numerous projects compete for those dollars Accept-reject vs. ranking approaches a. Accept-reject approach: Evaluate firm’s capital expenditure programs to determine whether they meet firm’s minimum acceptance criterion b. Ranking approach: Ranking capital expenditure projects on basis of predetermined measure such as rate of return Normal (conventional) vs. nonnormal (nonconventional) cash flow patterns a. Normal cash flow pattern: initial cash outflow followed by series of cash inflows b. Nonnormal cash flow pattern: initial cash outflow followed by series of cash inflows and outflows Relevant cash flows A. Relevant cash flows 1. Cash outlays already made = sunk costs: irrelevant to decision process and not included a. Sunk cost = cash outlay that already has been incurred and that cannot be recovered regardless whether the project is accepted or rejected b. Sunk costs incurred in past → Cannot be changed regardless whether project under consideration is accepted or rejected. Concerned with future incremental cash flows → Sunk costs not relevant in capital budgeting decision 2. Opportunity costs = cash flows that could be realized from best alternative use of asset are relevant 3. Analysis must consider externalities a. Project has positive or negative impact on firm’s other cash flows b. Ex: Cannibalization effect = situation when a new project reduces cash flows that the firm otherwise would have earned c. Projects effects on cash flows of firm’s other investments (both positive and negative) must be considered 4. Incremental cash flows a. Only cash flows associated with project b. Consider only after-tax cash flows B. Major cash flow components 1. Initial investment = relevant cash flow at time zero Initial investment = initial investment to acquire new asset – after-tax cash inflows from liquidation of old asset 2. Operating cash flows = incremental cash inflows resulting from implementation of project during its life Chapter 12: Cash Flow Estimation and Risk Analysis Page 2 operating cash flows = operating cash inflows from new asset – operating cash inflows from old asset 3. terminal cash flow = after-tax nonoperating cash flow occurring in terminal year of project. Usually attributed to liquidation of project terminal cash flow = after-tax cash flows from termination of new asset – after-tax cash flows from termination of old asset C. Expansion project cash flows vs. replacement projects cash flows 1. Expansion project: Identification of cash flows straight forward. Identify initial investment, operating cash flows and terminal cash flow. 2. Replacement project: Replace old asset with new asset. Identification of relevant cash flows more complicated. Must get incremental cash flows or net cash flows (i.e., cash flows from new asset – cash flows from old asset) D. Examples of relevant cash flows: 1. Cash inflows, outflows, and opportunity costs 2. changes in working capital 3. Installation, removal, and training costs 4. Terminal values 5. Depreciation 6. Existing asset effects F. Modified accelerated cost recovery system (MACRS) = system used to determine depreciation of assets for tax purposes 1. Property classes under MACRS a. 3 years: research equipment and some special tools b. 5 years: computers, typewriters, copiers, duplicating equipment, cars, lightduty trucks, qualified technological equipment and similar assets c. 7 years: office furniture, fixtures, most manufacturing equipment, railroad track, single purpose agricultural and horticultural buildings d. 10 years: equipment used in petroleum refining or in manufacture of tobacco products and certain food products e. 27.5 years: residential rental real property such as apartment buildings f. 39 years: All nonresidential real property, including commercial and industrial buildings 2. Depreciate asset at full cost including installation cost and shipping costs 3. Rounded depreciation percentages by recovery year using MACRS for first four property classes 4. Half-year convention = assumes assets are used for half of the first year and half of the last year 5. Residential property (27.5 year life) and commercial and industrial structures (39 years) must be depreciated with straight-line depreciation (but still allow for the half-year convention) 6. Land doesn’t depreciate. Chapter 12: Cash Flow Estimation and Risk Analysis Page 3 Recovery year 1 2 3 4 5 6 7 8 9 10 11 Totals III. 3 years 33% 45 15 7 5 years 20% 32 19 12 11 6 7 years 14% 25 17 13 9 9 9 4 100% 100% 100% 10 years 10% 18 14 12 9 7 7 7 7 6 3 100% Example: Replacement Project A. The facts: 1. Firm debating whether to replace old machine with new machine. New machine’s purchase price: $380,000 + additional installation cost of $20,000. New machine will be depreciated under MACRS 5-year recovery period 2. Old machine purchased 3 years ago for $240,000. Old machine depreciated under MACRS 5-year class rate 3. Firm expects new machine will require $35,000 increase in current assets and $18,000 increase in current liabilities to support new machine. 4. Firm in 40% tax bracket for ordinary income and capital gains 5. Firm has found buyer for old machine. Old machine will sale for $280,000. 6. Five years from now: new machine sold for $50,000 net of removal and clean up costs. All of new machine’s additional net working capital will be recovered. Five years from now old machine would be worth $0 as it would be completely obsolete. 7. Why buy new machine? New machine will increase revenue, but also will increase expenses (excluding depreciation). Yearly levels shown below Using New Equipment Using Old Equipment Year Revenue Expenses Year Revenue Expenses 1 $2,520,000 $2,300,000 1 $2,200,000 $1,990,000 2 $2,520,000 $2,300,000 2 $2,300,000 $2,110,000 3 $2,520,000 $2,300,000 3 $2,400,000 $2,230,000 4 $2,520,000 $2,300,000 4 $2,400,000 $2,250,000 5 $2,520,000 $2,300,000 5 $2,450,000 $2,350,000 B. Determine initial cash flows 1. Basic format for determining initial investment Chapter 12: Cash Flow Estimation and Risk Analysis Page 4 Installed cost of net asset= Cost of new asset + Installation cost associated with new asset - After-tax proceeds from sale of old asset Proceeds from sale of old asset - or + tax on sale of old asset + or – change in net working capital = Initial investment 2. 3. Net working capital a. = amount by which firm’s current assets exceed current liabilities b. change in net working capital = difference between change in current assets and change in current liabilities c. Purchase and operation of new machine → increase in levels of cash, accounts receivables, inventories, accounts payable, and accruals. i. Need more cash to support expanded operations, more accounts receivable, and inventories to support increased sales. ii. Need more accounts payable and accruals to support outlays made to meet expanded product demand. Tax treatment on sale of assets a. book value = installed cost of asset – accumulated depreciation b. Tax treatment i. If sales price > purchase price → difference is capital gain → taxed as ordinary income ii. Portion of sales price above book value but less than purchase price is recaptured depreciation → taxed as ordinary income iii. If sales price = book value → no capital gain or loss iv. If sales price < book value: a. If asset depreciable and used in business: loss deducted from ordinary income b. If asset is not depreciable and not used in business: loss only deducted against capital gains c. Example: Assume old asset purchased for $100,000. Current book value of old asset = $48,000. i. If old asset sold for $110,000 → $10,000 capital gain and $52,000 of recaptured depreciation → $62,000 taxed as ordinary income ii. If old asset sold for $70,000 → $22,000 of recaptured depreciation → $22,000 taxed as ordinary income iii. If old asset sold for $48,000 → no capital gain or loss iv. If old asset sold for $30,000 → loss of $18,000 Chapter 12: Cash Flow Estimation and Risk Analysis Page 5 4. Depreciation on old and new machines Old equipment Year -2 Book value at beginning of the year -1 0 1 2 3 $240,000 $192,000 $115,200 $69,600 $40,800 $14,400 Depreciation rate 20.00% 32.00% 19.00% 12.00% 11.00% 6.00% Depreciation expense $48,000 $76,800 $45,600 $28,800 $26,400 $14,400 $192,000 $115,200 $69,600 $40,800 $14,400 $0 Book value at end of year New equipment Year 1 Book value at beginning of the year 2 3 4 5 6 $400,000 $320,000 $192,000 $116,000 $68,000 $24,000 Depreciation rate 20.00% 32.00% 19.00% 12.00% 11.00% 6.00% Depreciation expense $80,000 $128,000 $76,000 $48,000 $44,000 $24,000 $320,000 $192,000 $116,000 $68,000 $24,000 $0 Book value at end of year 5. Now calculate initial cash outflows in year 0. Installed cost of proposed machine Cost of proposed machine $380,000 + installation cost 20,000 Total installed cost $400,000 - After-tax proceeds from sale of present machine Proceeds from sale of present machine $280,000 -Tax on present machine Sales price $280,000 Book value 69,600 Taxable amount $210,400 tax (40%) 84,160 195,840 +Change in net working capital Increase in current assets $35,000 Increase in current liabilities 18,000 17,000 Initial investment Chapter 12: Cash Flow Estimation and Risk Analysis $221,160 Page 6 C. Determining operating cash flows 1. Calculation of operating cash flows using income statement format Revenue -Expenses (excluding depreciation) Profits before depreciation and taxes -depreciation Net profits before taxes -taxes Net profits after taxes +depreciation Operating cash inflows 2. Return to book’s example: With proposed machine Revenue -Expenses (excluding depreciation) Profits before depreciation and taxes -Depreciation Net profits before taxes -Taxes Net profits after taxes + Depreciation Operating cash inflows With present machine Revenue -Expenses (excluding depreciation) Profits before depreciation and taxes -Depreciation Net profits before taxes -Taxes Net profits after taxes + Depreciation Operating cash inflows Incremental operating cash flows 1 2 Year 3 4 5 $2,520,000 $2,520,000 $2,520,000 $2,520,000 $2,520,000 2,300,000 2,300,000 2,300,000 2,300,000 2,300,000 $220,000 $220,000 $220,000 $220,000 $220,000 80,000 128,000 76,000 48,000 $44,000 $140,000 $92,000 $144,000 $172,000 $176,000 $56,000 $36,800 $57,600 $68,800 $70,400 $84,000 $55,200 $86,400 $103,200 $105,600 80,000 128,000 76,000 48,000 $44,000 $164,000 $183,200 $162,400 $151,200 $149,600 $2,200,000 $2,300,000 $2,400,000 $2,400,000 $2,450,000 1,990,000 2,110,000 2,230,000 2,250,000 2,350,000 $210,000 $190,000 $170,000 $150,000 $100,000 28,800 26,400 14,400 0 0 $181,200 $163,600 $155,600 $150,000 $100,000 72,480 65,440 62,240 60,000 40,000 $108,720 28,800 $137,520 $98,160 26,400 $124,560 $93,360 14,400 $107,760 $90,000 0 $90,000 $60,000 0 $60,000 $26,480 $58,640 $54,640 $61,200 $89,600 Chapter 12: Cash Flow Estimation and Risk Analysis Page 7 D. Determine terminal cash flows 1. Basic format for determining terminal cash flow After-tax proceeds from sale of new asset Proceeds from sale of new asset - or + tax on sale of new asset -After-tax proceeds from sale of old asset Proceeds from sale of old asset - or + Tax on sale of old asset - or + Change in net working capital Terminal Cash flow 2. Return to example: After-tax proceeds from sale of proposed machine Proceeds from sale of proposed machine $50,000 - Tax on sale of proposed machine Proceeds $50,000 Book value 24,000 Recaptured depreciation 26,000 Tax 10,400 Total after-tax proceeds $39,600 -After-tax proceeds from sale of present machine Proceeds from sale of proposed machine - Tax on sale of proposed machine Proceeds $0 Book value 0 Recaptured depreciation $0 Tax Total after-tax proceeds + Change in net working capital 0 0 17,000 Terminal cash flow E. $0 $56,600 Projects cash flows Year 0 Initial investment -$221,160 Operating cash flow 0 Terminal cash flow 0 Conventional relevant cash flow -$221,160 Chapter 12: Cash Flow Estimation and Risk Analysis 1 $0 26,480 0 $26,480 2 $0 58,640 0 $58,640 3 $0 54,640 0 $54,640 4 $0 61,200 0 $61,200 5 $0 89,600 56,600 $146,200 Page 8 F. Analysis 1. Net present value a. Excel: +NPV(0.10, 26480,58640,54640,61200,146200)-221160=$25,006 b. Math: $26,480 $58,640 $54,640 $61,200 $146,200 NPV = -$221,160 + + + + + = $25,006 1.10 1.102 1.103 1.104 1.105 2. 3. c. Decision: NPV = $25,006 > 0 → Accept project Internal rate of return a. Excel Spreadsheet: A B C D E F 1 -$221,160 $26,480 $58,640 $54,640 $61,200 $146,200 Excel function: +IRR(A1:F1,0.10)= 13.43% b. Math: $26,480 $58,640 $54,640 $61,200 $146,200 NPV = -$221,160 + + + + + = $0 1.1343 1.13432 1.13433 1.13434 1.13435 c. Decision: IRR = 13.43% > 10.0% → Accept project Modified internal rate of return a. Cash flows and terminal value = FV of cash inflows Year 0 1 2 3 4 5 Cash Flows -$221,160 $26,480 $58,640 $54,640 $61,200 $146,200 Future Values $38,769 $78,050 $66,114 $67,320 $146,200 Terminal value = $26,480(1.10)4 + $58,640(1.10)3 + $54,640(1.10)2 + $61,200(1.10) + $128,200 Terminal value = $396,454 b. Math: N N N-t t COFt å (1 + r) t=0 å CIF (1 + r) t = t=0 (1 + MIRR)N 1 c. 4. $396,454 æ$396,454 ö 5 MIRR= $221,160 = → ç ÷ - 1 = 12.38% è$221,160 ø (1 + MIRR)5 Excel Spreadsheet: A B C D E F 1 -$221,160 $26,480 $58,640 $54,640 $61,200 $146,200 Excel function: +MIRR(A1:F1,0.10,0.10)= 12.38% d. Decision: MIRR = 12.38% > 10.0% → Accept project Payback period a. Cash flows and cumulative cash flows Year 0 1 2 3 4 5 Cash Flows -$221,160 $26,480 $58,640 $54,640 $61,200 $146,200 Cumulative Cash Flows -$221,160 -$194,680 -$136,040 -$81,400 -$20,200 $126,000 Chapter 12: Cash Flow Estimation and Risk Analysis Page 9 b. c. IV. Payback period = 4+ (20,200/146,200) = 4.14 years Decision rule: If 4.14 > N* = 4 → Reject the project Example: Expansion Project A. Assumptions: Assume it is 2006. 1. New product: Can sell 20,000/year at $3,000 each 2. Project’s economic life = 4 years, 2007, 2008, 2009, 2010. Operations commence January 2007 and end December 31, 2010. 3. Variable costs: $2,100 per unit. Fixed overhead cost, excluding depreciation = $8 million per year. 4. Idea for product came as by-product from work company already doing. R&D manager authorized expenditure of $500,000 for feasibility study in 2005. Expense incurred in 2005, charged to general corporate R&D and expensed in 2005 for tax purposes. 5. Purchased new building need for production in 2006. Building cost $12 million. Building will be depreciated under MACRS with a 39-year life. 6. Equipment needed for production purchased in 2006. Cost: $8 million, including transportation. Depreciated under MACRS with 5-year class life. 7. Project will require one-time investment in net working capital of $6 million made in 2006. All of this investment will be recovered at end of project. 8. At end of project, building will have market value of $7.5 million and equipment will have market value of $2 million. 9. Assume all cash flows occur at end of year. Tax rate = 40%. Corporate WACC = 12%. B. Analysis: 1. Initial cash outflows a. Generally: initial investment = Installed cost of net assets = Cost of new assets + Installation cost associated with new assets + new investment net working capital = Initial investment b. Initial cash outflows listed below (in $1,000) Asset Amount Building Depreciable basis $12,000 $12,000 Equipment (including shipping) $8,000 $8,000 Investment in net working capital $6,000 Total Chapter 12: Cash Flow Estimation and Risk Analysis $26,000 Page 10 2. Depreciation schedule is shown below (in $1,000) Building (39-year life) 2007 2008 Book value (beginning of the year) $11,844 $11,532 $11,220 1.3% 2.6% 2.6% 2.6% 156 312 312 312 $11,844 $11,532 $11,220 $10,908 Depreciation expense (building) Equipment (5-year life) 2010 $12,000 Depreciation rate Book value (end of the year) 2009 2007 2008 2009 2010 Book value (beginning of the year) $8,000 $6,400 $3,840 $2,320 Depreciation rate 20.0% 32.0% 19.0% 12.0% Depreciation expense (building) $1,600 $2,560 $1,520 $960 Book value (end of the year) $6,400 $3,840 $2,320 $1,360 3. Operating cash flows a. Generally: operating cash flows = Revenue -Expenses (excluding depreciation) Profits before depreciation and taxes -depreciation Net profits before taxes (EBIT) -taxes Net profits after taxes (NOPAT) +depreciation Operating cash inflows b. Operating cash flows listed below (in $1,000) 2007 2008 2009 2010 20,000 20,000 20,000 20,000 $3 $3 $3 $3 Sales revenue $60,000 $60,000 $60,000 $60,000 Variable costs 42,000 42,000 42,000 42,000 8,000 8,000 8,000 8,000 156 312 312 312 1,600 2,560 1,520 960 EBIT $8,244 $7,128 $8,168 $8,728 Taxes 3,298 2,851 3,267 3,491 $4,946 $4,277 $4,901 $5,237 1,756 2,872 1,832 1,272 $6,702 $7,149 $6,733 $6,509 Units sold Sales price Fixed operating costs Depreciation (building) Depreciation (equipment) NOPAT Add back depreciation Operating cash flow Chapter 12: Cash Flow Estimation and Risk Analysis Page 11 4. Terminal values = salvage values a. In general: After-tax proceeds from sale of new asset Proceeds from sale of new asset - or + tax on sale of new asset - or + Change in net working capital Terminal Cash flow b. Gains or losses from selling assets are taxes as ordinary income i. Losses create additional tax savings which increase cash flow ii. Gains create additional tax liabilities which decrease cash flows Cash flows from sale of assets are listed below in $1,000 c. Building Equipment Total Market value in 2010 $7,500 $2,000 Book value in 2010 10,908 1,360 Gain or loss -3,408 640 Tax liability or credit -1,363 256 Net cash flow from salvage $8,863 $1,744 d. Additional terminal year cash flows are listed below in $1,000 Return of net operating working capital Net cash flows from salvage Total termination cash flows e. 2010 $6,000 10,607 $16,607 Project cash flows are reported below in $1,000 Year Cash Flows f. $10,607 2006 2007 2008 2009 2010 -$26,000 $6,702 $7,149 $6,733 $23,116 Project analysis i. Net Present value: WACC = 12% (1) Excel: +NPV(0.12, 6702,7149,6733,23116)-26000=$5,166 (2) Math: $6,702 $7,149 $6,733 $23,116 NPV = -$26,000 + + + + = $5,166 1.12 1.122 1.123 1.124 (3) Decision: NPV = $5,166 > 0 → Accept project ii. Internal rate of return: WACC = 12% (1) Excel Spreadsheet: A B C D E 1 -$26,000 $6,702 $7,149 $6,733 $23,116 Chapter 12: Cash Flow Estimation and Risk Analysis Page 12 Excel function: +IRR(A1:E1,0.10)= 19.33% (2) Math: $6,702 $7,149 $6,733 $23,116 NPV = -$26,000 + + + + = $0 2 3 1.1933 1.1933 1.1933 1.19334 (3) Decision: IRR = 19.33% > 12.0% → Accept project iii. Modified internal rate of return = MIRR (1) Cash flows and terminal value = FV of cash inflows Cash Flows Future Value 2006 -$26,000 2007 $6,702 $9,416 2008 $7,149 $8,967 2009 $6,733 $7,541 2010 $23,116 $23,116 Terminal value = $6,702(1.12)3 + $7,149(1.12)2 + $6,733(1.12)1 + $23,116 = $49,041 (2) Math: N N å CIF (1 + r) COFt å (1 + r) N-t t t = t=0 t=0 (1 + MIRR)N 1 $49,041 æ$49,041 ö 4 MIRR= $26,000 = → ç ÷ - 1 = 17.19% è$26,000 ø (1 + MIRR)4 (3) Excel Spreadsheet: A B C D E 1 -$26,000 $6,702 $7,149 $6,733 $23,116 Excel function: +MIRR(A1:E1,0.12,0.12)= 17.19% (4) Decision: MIRR = 17.19% > 12.0% → Accept project iv. Payback period (1) Cash flows and cumulative cash flows 2006 -$26,000 2007 $6,702 -$19,298 Cumulative cash flow (2) C. 2008 $7,149 -$12,149 2009 $6,733 -$5,416 2010 $23,116 $17,700 Payback = 3 + 5416/23116 = 3.23 Decision: If 3.23 > N* = 3 → Reject project Measuring stand alone 1. Sensitivity analysis a. Key variables are changed one at a time and the resulting changes in NPV are observed. b. Base case = most likely values c. Return to the book’s expansion example: Chapter 12: Cash Flow Estimation and Risk Analysis Page 13 i. Deviation Sales from Base Price -30 -$27,637 -15 -$11,236 0 $5,166 15 $21,568 30 $37,970 ii. Deviations from base case NPV at Different Deviations from Base Variable Sales Year 1 Fixed Cost Growth Sales Cost $28,129 -$5,847 -$4,675 $9,540 $16,647 -$907 $246 $7,353 $5,166 $5,166 $5,166 $5,166 -$6,315 $12,512 $10,087 $2,979 -$17,796 $21,269 $15,007 $792 WACC $8,294 $6,674 $5,166 $3,761 $2,450 The larger the range and stepper the slope the more sensitive the NPV is to a change in the variable Sensitivity Analysis $50,000 Sales Price Variable Cost Sales Growth Year 1 Sales Fixed costs WACC $40,000 $30,000 NPV ($) $20,000 $10,000 $0 from Base Price Cost Growth Sales -$10,000 -$20,000 -$30,000 -$40,000 Deviation (%) 2. Scenario analysis a. = Risk analysis technique in which “bad” and “good” sets of financial circumstances are compared with a most likely or base case situation b. Worst case scenario i. Input variables are set at their worst reasonably forecasted values ii. Low sales, low price, high cost c. Best case scenario i. Input variables are set at their best reasonably forecasted values ii. High sales, high price, low cost Chapter 12: Cash Flow Estimation and Risk Analysis Page 14 Continuing book’s example d. Scenario Best case Base case Worst case Probability 25% 50% 25% Unit Sales 26,000 20,000 14,000 Sales Price $3.90 3.00 2.10 Variable Costs $1.47 2.10 2.73 NPV $87,503 $5,166 -$43,711 Expected NPV = 0.25($87,503) + 0.50($5,166) +0.25(-$43,711) =$13,531 Standard deviation = [0.25($87,503-$13,531)2+0.50($5,116-$13,531)2+0.25(-$43,711-$13,531)2]1/2 =$47,139 CV = Coefficient of variation = $47,139/$13,531 = 3.48 If firm’s average project has a CV of 2.0 → Project is riskier than firm’s other projects 3. Monte Carlo simulation a. Computer technique that analyzes a large number of scenarios b. Computer picks at random values for units sold, variable costs per unit, sales price, etc., and calculates NPV for each scenario c. Process is repeated many times (Ex: 1,000 runs generate 1,000 NPVs) → calculate average NPV, standard deviation, CV, and probability NPV would be negative d. To use Monte Carlo simulations, one needs both probability distributions for the inputs and correlation coefficients between each pair of inputs → difficult to obtain reasonable values for the correlations, especially for new projects where no historical data are available D. Abandonment option 1. Option of abandoning project if operating cash flows turn out lower than expected 2. Option can increase expected profitability and reduce risks 3. Continuing book’s example a. Assume can abandon after year 1. Sell assets at end of year 1 for book value = $18.244 (no tax implications) b. Assume receive cash flows = $18.244 million from asset sale in year 2 c. Spreadsheets i. Situation 1: Cannot abandon (WACC = 12%) Scenario Best Case Base Case Worst Case Probability 25% 50% 25% 2006 -$26,000 -$26,000 -$26,000 ii. 2007 $33,810 6,702 -9,390 2008 $34,257 7,149 -8,943 2009 $33,841 6,733 -9,359 2010 $50,224 23,116 7,024 Expected NPV Standard deviation Coefficient of Variation NPV $87,503 5,166 -43,711 $13,531 $47,139 3.48 Situation 2: Can abandon after Year 1 (WACC = 12%) Chapter 12: Cash Flow Estimation and Risk Analysis Page 15 Scenario Best Case Base Case Worst Case #1 Worst Case #2 Probability 25% 50% 25% 25% 2006 -$26,000 -$26,000 -$26,000 -$26,000 2007 $33,810 6,702 -9,390 -9,390 2008 $34,257 7,149 -8,943 18,244 2009 2010 $33,841 $50,224 6,733 23,116 -9,359 7,024 0 0 Expected NPV Standard deviation Coefficient of Variation NPV $87,503 5,166 -43,711 -19,840 $19,499 $40,567 2.08 Disregard Choose Expected NPV = 0.25($87,503) + 0.50($5,166) +0.25(-$19,840) = $19,499 Standard deviation = [0.25($87,503-$19,499)2+0.50($5,116-$19,499)2+0.25(-$19,840-$19,499)2]1/2 =$40,567 CV = Coefficient of variation = $40,567/$19,499 = 2.08 iii. Value of real option to abandon = Expect NPV with Abandonment – Expect NPV without Abandonment Value of real option to abandon = $19,499 - $13,531 = $5,968 Chapter 12: Cash Flow Estimation and Risk Analysis Page 16
