STATION 1 State one reason why the cane toads were imported to
advertisement
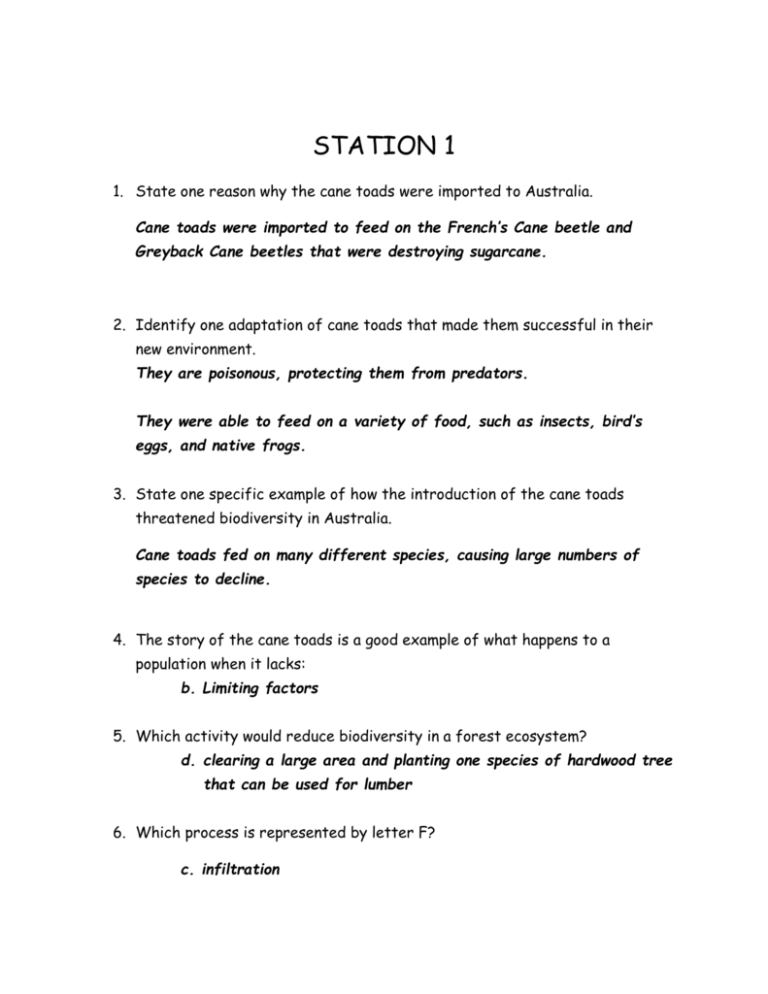
STATION 1 1. State one reason why the cane toads were imported to Australia. Cane toads were imported to feed on the French’s Cane beetle and Greyback Cane beetles that were destroying sugarcane. 2. Identify one adaptation of cane toads that made them successful in their new environment. They are poisonous, protecting them from predators. They were able to feed on a variety of food, such as insects, bird’s eggs, and native frogs. 3. State one specific example of how the introduction of the cane toads threatened biodiversity in Australia. Cane toads fed on many different species, causing large numbers of species to decline. 4. The story of the cane toads is a good example of what happens to a population when it lacks: b. Limiting factors 5. Which activity would reduce biodiversity in a forest ecosystem? d. clearing a large area and planting one species of hardwood tree that can be used for lumber 6. Which process is represented by letter F? c. infiltration 7. What does letter X represent? a. the water table 8. If the surface soil is saturated and precipitation increases, there will be d. an increase in the amount of runoff 9. The processes of transpiration and evaporation are represented by letters c. C and A 10. Based on the graph at the right, what is the most abundant gas in the atmosphere? Nitrogen STATION 2 Read the passage below, then answer the questions on experimental design that follow. Poison ivy is a weed that grows in New York State. It synthesizes an oil, urushiol, that causes skin rashes. Researchers have found that if poison ivy grows in an environment that contains an increased concentration of carbon dioxide, the plants grow larger, faster, and produce more urushiol. Because carbon dioxide levels in the atmosphere are rising, poison ivy might become a hazard to people who work or vacation outdoors. In order to verify this research, experiments must be carried out. Design an experiment to test whether poison ivy is affected by air containing higher than normal concentrations of carbon dioxide. In your answer, be sure to: 1. State the hypothesis the experiment would test (remember, the hypothesis should be a statement, not a question) Increased concentrations of CO2 will produce poison ivy plants that grow larger and faster, and produce more urushiol. 2. State one way the control group should be treated differently from the experimental group Control group should contain a “normal”, concentration of CO2 (similar to current natural conditions) while the experimental group should contain higher concentrations of CO2. 3. identify two conditions (CONSTANTS) that should be kept the same in both the control and the experimental groups Same number of poison ivy plants, same amount of water, same amount of sunlight, same temperature… 4. Identify the independent variable in your experiment. CO2 concentration 5. Identify the dependent variable in your experiment. Size of plant, rate of growth, amount of urushiol produced. 6. When water used to cool machinery is returned to a river, it raises the river water temperature. This causes a sharp decline in small invertebrate populations. Based on the food web shown above, a likely consequence of this change would be d. decrease in the number of crayfish Match the type of model in the first column to an example in the second column. 7. Physical C A. Computer program 8. Graphical D B. Concept map/flow chart 9. Conceptual B C. Model of DNA 10. Mathematical A D. Road map STATION 3 The data table shows the concentrations of oxygen in parts per million (ppm) present in freshwater and seawater at various temperatures. Directions: Using the information in the data table, construct a line graph on the grid on the next page, following the directions below. 1. Mark an appropriate scale on each labeled axis. 2. Plot the data for freshwater oxygen concentration on the grid. Surround each point with a small circle and connect the points. 3. Plot the data for seawater oxygen concentration on the grid. Surround each point with a small triangle and connect the points. 4. State one relationship between temperature and dissolved oxygen concentration in water. As temperature increases, the amount of dissolved oxygen decreases (in both fresh and salt water) 5. Predict the oxygen concentration in freshwater at 35°C. ___~6.5_____ppm 6. Which group would most likely have the greatest survival success during a long period of environmental changes? b. a large population of red ants living in a forest 7. Which human activity would most likely deplete finite resources? D. uncontrolled population growth STATION 4 1. In what units is oil production being measured in the chart above? Thousand barrels/day 2. Based on the data given, how much oil would you expect to be produced for the month of December 2013 in the Haynesville region? 58 thousand barrels/day x 31 days = 1,798 thousand barrels (1.798 million barrels) 3. Give an example of what the oil produced might be used for. Transportation 4. In what units is gas production measured? Million cubic feet/day 5. What is an advantage of natural gas over petroleum? Natural gas is cleaner 6. What do oil and natural gas have in common? Both are fossil fuels 7. Identify one specific gas that contributes to the problem of global warming. CO2, Water vapor… 8. State one activity of humans that increases the concentration of this gas. Burning fossil fuels, transportation, deforestation (fewer trees to remove CO2) 9. Describe one negative effect of global warming on humans or ecosystems. Rising sea level, changing precipitation patterns (ex. Drought), inability of animals to adapt… 10. Explain why switching to more efficient lightbulbs will help reduce the school’s contribution to global warming. Less fossil fuels (coal) will need to be used to generate electricity therefore less CO2 will be released into atmosphere \ STATION 5 1. What is the difference between nuclear fission and nuclear fusion? Fission splits the nuclei of atoms; fusion combines the nuclei of atoms 2. Which type of reaction (fission or fusion) takes place in a nuclear reactor? Fission 3. Look at the diagram below. Describe what is occurring at each step (14). There are four main stages: 1) the fuel is burned to boil water to make steam 2) the steam makes a turbine spin 3) the spinning turbine turns a generator which produces electricity 4) the electricity goes to the transformers to produce the correct voltage 4. Where does most of the energy for step 1 on the diagram come from in the United States? Burning coal 5. Pollution that comes from 1 source (ex. BP’s Deepwater Horizon oil rig) is known as __point____ pollution. 6. State two ways that the use of windmills to produce energy would be beneficial to the environment. Doesn’t burn fossil fuel so it does not release greenhouse gases Does not release particulate matter/other pollutants It is a renewable source of energy STATION 6 1. Describe a trade-off that must be considered in the decision whether to move forward with hydrofracking. Consider the amount of natural gas that can be extracted and used for energy compared to the threats to the environment (such a pollution from fracking, greenhouse gases released, etc) 2. Identify one renewable alternative to natural gas as an energy source that New York State could use and describe the advantage of using this source, other than it is renewable. Renewables include wind, hydroelectric, and solar power. These energy sources produce less pollution and do not release greenhouse gases into the atmosphere. 3. State 3 problems associated with the use of fossil fuels. Release greenhouse gases Release particulate matter Pollution can contribute to human health problems Increase temperatures & effects related to global climate change Non-renewable 4. State one specific reason why public health officials are concerned about the use of these chemicals Accumulate in body and threaten human health. Possible thyroid problems, infertility, reproductive defects… 5. identify the technique used to determine exposure levels to these chemicals in humans Biomonitoring tests for levels of industrial chemicals found in the body 6. state one possible reason why young children might have higher levels of exposure to these chemicals than do adults Smaller body size; greater exposure to products that contain the chemicals (fire-retardant clothing, toys, bottles, etc.) 7. What are the 2 main compounds that react to form ground-level ozone? Nitrogen oxides & VOCs 8. What is the source of VOCs that are shown in the diagram? Petroleum products like gasoline 9. Other than the source identified in questions 8, what are some other sources of VOCs? Paint thinners, varnishes, chemical cleaners, etc. 10. Is ground-level ozone considered a primary pollutant or a secondary pollutant? Why? Secondary; forms when primary pollutants (NOx & VOCs) react with each other and with gasses in atmosphere.
