Conclusions
advertisement
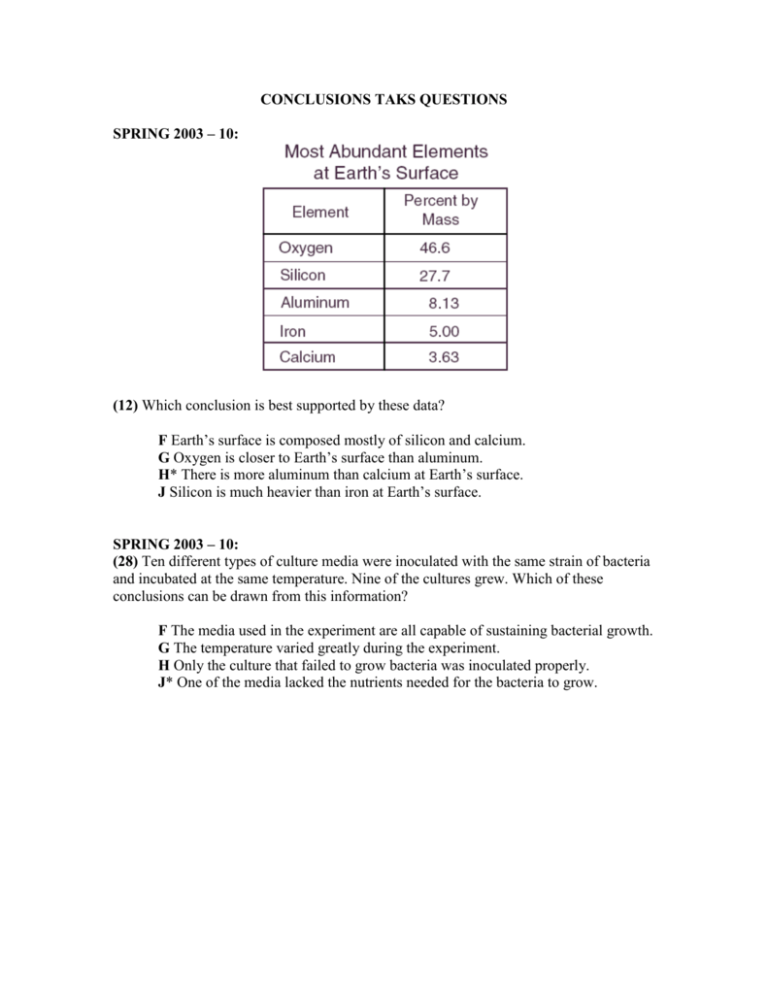
CONCLUSIONS TAKS QUESTIONS SPRING 2003 – 10: (12) Which conclusion is best supported by these data? F Earth’s surface is composed mostly of silicon and calcium. G Oxygen is closer to Earth’s surface than aluminum. H* There is more aluminum than calcium at Earth’s surface. J Silicon is much heavier than iron at Earth’s surface. SPRING 2003 – 10: (28) Ten different types of culture media were inoculated with the same strain of bacteria and incubated at the same temperature. Nine of the cultures grew. Which of these conclusions can be drawn from this information? F The media used in the experiment are all capable of sustaining bacterial growth. G The temperature varied greatly during the experiment. H Only the culture that failed to grow bacteria was inoculated properly. J* One of the media lacked the nutrients needed for the bacteria to grow. SPRING 2003 – 10: (29) Which conclusion about the frogs is supported by these data? A Four frogs out of ten preferred the green area. B* The frogs randomly moved into the colored areas. C Most frogs tended to avoid the red area. D Most frogs preferred the color blue SPRING 2003 – 10: (44) In an investigation 10,000 dung beetles were examined for the presence of parasites. The data showed that about 5% of the beetles had parasites. The results are — F invalid because only dung beetles were examined G unsupported because the parasite population was small H erroneous because more beetles should have had parasites J* valid because the sample size was sufficient for accuracy SPRING 2003 – 11: (22) The table shows environmental factors and soybean production for three regions. Which of the following probably accounts for the decrease in soybean yield in Region 1? F* High levels of ozone damaged the soybean plants, decreasing the average yield. G Low rainfall amounts failed to meet the plants’ moisture needs and inhibited growth. H Poor mineral levels found in the soil in that region limited the soybean harvest. J Higher-than-normal rainfall increased pest activity, decreasing the average yield. SPRING 2003 – 11: (31) An environmental-science company measured the ozone pollutant levels at two different locations in a metropolitan area. Which statement is best supported by these data? A Lower fuel efficiency and northerly winds in the winter increase ozone pollution the most. B Northwest winds in the spring transport ozone pollution into the metropolitan area. C* High summer temperatures and southerly winds contribute to high levels of ozone. D Heavy use of automobiles changes ozone levels the most. SPRING 2003 – 11: (44) According to the table, which workers have the greatest chance of experiencing significant hearing loss over time? F Police traffic officers G Shoe-factory workers H* Road-construction crews J Library desk clerks APRIL 2004 -11: (11) The graph shows the results of a study testing chemical pesticides on a pest species common to cotton plants. Different chemical pesticides were used in five different areas. According to these results, which of the following is the most effective chemical for controlling this pest species? AR BS C* T DV APRIL 2004 – 11: (34) A certain commercial product used for cleaning ovens must be handled with rubber gloves. The product is slippery and turns litmus paper blue. It probably contains — F an acid G* a base H a salt J an isotope APRIL 2004 – 11: (50) The graph shows metabolic rates for two types of fish at different environmental temperatures. Which of the following conclusions can be drawn from these data? F* Fish metabolism responds to temperature changes. G Metabolic rates decrease as environmental temperatures increase. H Fish body temperature results from high metabolism. J Metabolic rates are independent of environmental temperature. JULY 2004 – 11: (3) The graph shows the relative basal metabolic rates of a field mouse and an anole (a type of lizard) at different temperatures. According to this information, the field mouse — A* uses the least energy when the environmental temperature is 30°C B is able to control its body temperature C uses less energy at 20°C than the anole does D is unaffected by environmental temperatures FALL 2005 – 11: 11 The picture shows the results of a demonstration using the simple water plant Elodea. When the setup was placed in strong light, a space gradually appeared above the water in the graduated cylinder containing the plant. The gas in the space above the water was mostly — A. B. C. D. *oxygen carbon dioxide hydrogen nitrogen FALL 2005 – 11, FEBRUARY 2006 – 11 #33, JULY 2006 – 11 #33: 14 A glass is held upside down so that its open end is closed by the water’s surface. Soon air bubbles begin to escape from the glass. The best explanation for this observation is that — F. water condenses on the glass and escapes G. air in the glass increases the water temperature and causes bubbling H. pressurized water vapor rises rapidly and evaporates J. *air trapped in the glass is warmed and expands in volume FALL 2005 – 11: 49 The diagram represents helium gas expanding to fill a larger container. What is the ratio of the helium gas’s density at the final volume to its density at the initial volume? A. 1:1 B. 4:1 C. *1:8 D. 1:50 FALL 2005 – 11: 52 According to this information, three of these organisms should be placed in the same kingdom. Which organism should be placed in a different kingdom? F Q G *R H S J T OCTOBER 2005 – 11: 4 Which of the following conclusions is supported by the information above? F Antibiotics have intensified the symptoms of M. tuberculosis infections. G M. tuberculosis is becoming extinct because of antibiotics. H Antibiotics have caused M. tuberculosis to reproduce at a faster rate. J * M. tuberculosis has developed resistance to antibiotics. OCTOBER 2005 – 11: 8 The picture shows the results of a demonstration using the simple water plant Elodea. When the setup was placed in strong light, a space gradually appeared above the water in the graduated cylinder containing the plant. The gas in the space above the water was mostly — F * oxygen G carbon dioxide H hydrogen J nitrogen OCTOBER 2005 – 11, APRIL 2006 – 11 #48: 22 Which of the following conclusions is supported by the information above? F* Trade winds help maintain some food chains. G Trade winds produce useful minerals in some oceans. H Trade winds can reverse parts of the water cycle. J Trade winds may be able to reduce greenhouse gases. OCTOBER 2005 – 11: 25 Boiling water can be used to sanitize dishes. The data above show how sanitizing time varies in different locations. Which inference is supported by these data? A The boiling point of water is constant at higher altitudes. B * The boiling point of water is affected by elevation. C Water takes longer to boil at Fort Davis than at sea level. D Boiling water changes temperature at a faster rate at Corpus Christi than at higher elevations. OCTOBER 2005 – 11, APRIL 2006 – 11 #51: 47 A study was conducted to test the effectiveness of hearing aids. People with different types of hearing loss were included in the study. Which question would help in determining whether the conclusion above is valid? A What was the average age of the people in the study? B What was the most common occupation of people in the study? C*How many people were included in the study? D How many people in the study had vision problems? APRIL 2006 – 10: 1 A student prepared this graph of tornadoes reported over a 50-year period in a midwestern state. Which statement is supported by these data? A *Tornadoes are less frequent in the morning. B Darkness increases the strength of tornadoes. C Tornadoes occurring at night are brief. D The probability of a tornado is the same throughout the day. APRIL 2006 – 10: 49 These data show how the mass of an undisturbed beaker of alcohol varied during a class period. Which of the following is the best conclusion that can be made about the investigation? A The beaker absorbed moisture from the air. B A chemical change occurred in the beaker. C The beaker experienced a change of state. D* Some material evaporated from the beaker. FEBRUARY 2006 – 11, JULY 2006 – 11 #6: 7 The graph compares absenteeism of elementary school students who wash their hands properly with absenteeism of students who fail to wash their hands properly. Which inference could best be supported by these data? A* Proper hand-washing may increase attendance among elementary school students. B Older students have developed better hand-washing habits than younger students. C Some elementary school classes teach correct hand-washing methods to students. D Improper hand-washing is a common practice among most elementary school students. FEBRUARY 2006 – 11, JULY 2006 – 11 #44: 11 The pictures show a 10-newton block of wood being used to demonstrate how this instrument measures pressure. According to these data, the pressure of the block is a measure of the block’s— A* weight distributed over an area B density along each face C mass per unit of volume D change in inertia FEBRUARY 2006 – 11, JULY 2006 – 11 #21: 17 After 15 minutes the food coloring in Beaker A is evenly spread throughout the beaker, while Beaker B contains a thin layer of food coloring only at its bottom. These observations support the theory that convection currents in a fluid form more quickly if the fluid has — A* warmer layers at the bottom B a covering on its surface C reduced pressure on the bottom D contact with a cooler surface APRIL 2006 – 11: 26 Boiling water can be used to sanitize dishes. The data above show how sanitizing time varies in different locations. Which inference is supported by these data? F The boiling point of water is constant at higher altitudes. G* The boiling point of water is affected by elevation. H Water takes longer to boil at Fort Davis than at sea level. J Boiling water changes temperature at a faster rate at Corpus Christi than at higher elevations. APRIL 2006 – 11: 28 What can be concluded from the relationships described above? F Gas molecules travel longer distances at greater speeds when the volume of the gas is decreased. G A gas is more likely to lose kinetic energy when its volume is reduced. H* Gas molecules collide less frequently when the volume of the gas is increased. J A gas is more likely to increase in momentum when its volume is increased.
