Oneway Analysis of Transgenic Plants (GFP +) By Fragaria
advertisement
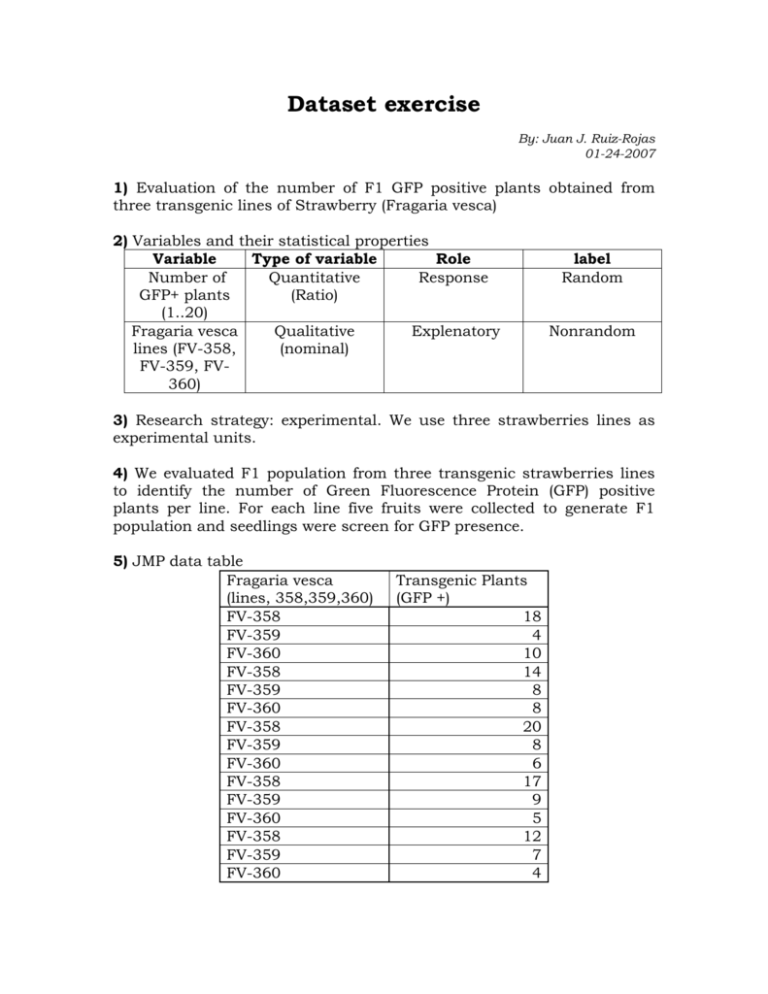
Dataset exercise By: Juan J. Ruiz-Rojas 01-24-2007 1) Evaluation of the number of F1 GFP positive plants obtained from three transgenic lines of Strawberry (Fragaria vesca) 2) Variables and their statistical properties Variable Type of variable Role Number of Quantitative Response GFP+ plants (Ratio) (1..20) Fragaria vesca Qualitative Explenatory lines (FV-358, (nominal) FV-359, FV360) label Random Nonrandom 3) Research strategy: experimental. We use three strawberries lines as experimental units. 4) We evaluated F1 population from three transgenic strawberries lines to identify the number of Green Fluorescence Protein (GFP) positive plants per line. For each line five fruits were collected to generate F1 population and seedlings were screen for GFP presence. 5) JMP data table Fragaria vesca (lines, 358,359,360) FV-358 FV-359 FV-360 FV-358 FV-359 FV-360 FV-358 FV-359 FV-360 FV-358 FV-359 FV-360 FV-358 FV-359 FV-360 Transgenic Plants (GFP +) 18 4 10 14 8 8 20 8 6 17 9 5 12 7 4 6) Summary Table N Rows N (FV lines) FV-358 5 5 5 16.2 3.19 10.2 1.43 FV-359 5 5 5 7.2 1.92 3.7 0.86 FV-360 5 5 5 6.6 2.41 5.8 1.08 FV lines N (Plants GFP +) Mean (Plants GFP +) Std Dev (Plants GFP +) Variance (Plants GFP +) Std Err (Plants GFP +) 7- f) Explain the similarities, differences, and relationships among the statistics standard error, standard deviation, and variance (What aspect-location, dispersion, or shape--of the data do they describe, what type of variable do they apply to, and how do they differ? Specifically, answer these questions for each of the three statistics: The standard error is the estimated standard deviation of a statistic. The standard error of a sample mean is just the sample standard deviation divided by the square root of the sample size. The standard error of a rate is a measure of the sampling variability of the rate The standard deviation is kind of the "mean of the mean," a measure of the dispersion of a set of data from its mean. The more spread apart the data is, the higher the deviation. Also, Standard deviation is a statistical measure of spread or variability, statistical measure of dispersion: a statistical measure of the amount by which a set of values differs from the arithmetical mean, equal to the square root of the mean of the differences' squares The variance is a measure of its statistical dispersion, indicating how far from the expected value its values typically are. A measure of the average distance between each of a set of data points and their mean value; equal to the sum of the squares of the deviation from the mean value. The variance of a distribution is the average of squares of the distances from the values drawn from the mean of the distribution The variance expresses the same type of information as does standard deviation, but it has certain very important properties relative to probability and hypothesis testing that make it distinctly superior, also the variance has square units. The standard deviation is the positive square root of the variance The standard error of a statistic is refereed also as a standard deviation; it has significant importance in hypothesis testing and related procedures i- Does the statistic measure (a) location, (b) dispersion, (c) or shape? Standard deviation, measure dispersion ii- Whatever it measures, does it measure it for (a) qualitative categorical variables, or (b) quantitative measurement variables? Standard error, measure quantitative measurement variables iii- Whatever it measures, does it measure it for (a) the underlying random variable of interest, or (b) the sample mean? ). Variance, measure for the underlying random variable of interest 8) Do you believe there is a statistically significant difference among the group means you tabulated? Why or why not? According with the means that I have calculated, there is a big difference between FV-358 lines (mean 16.2) to FV-359 (7.2) and FV-360 (6.6) lines. The average of plants GFP+ from line FV-358 is more than two times bigger than the average of FV-359 and FV-360, also the variance is two times bigger than the others lines, showing that FV-358 line has either significant statistical progress or good genetically qualities among these lines. Moreover, between lines FV-359 and FV-360, there is not difference, as we can see in the summary table. 9) Do you believe there is a biologically important difference among the means you tabulated? Why or why not? There is a biological important difference in this experiment, because we have detected a big amount of transgenic plants in one of three lines evaluated. It means that the plant transformation protocol for strawberries works better in the line FV-358 because we have been detected a bigger number of transgenic GFP+ plants. Besides, lines FV359 and FV-360, are lines that have almost the same mean, and we can predict that there is not necessary to include both of then for future experiments as a control for low level of plant transformation and GFP expression. Finally, future experiments can be conducted using this information as a support for improvement strawberry genomics studies


