Mzimvubu to Keiskamma
advertisement
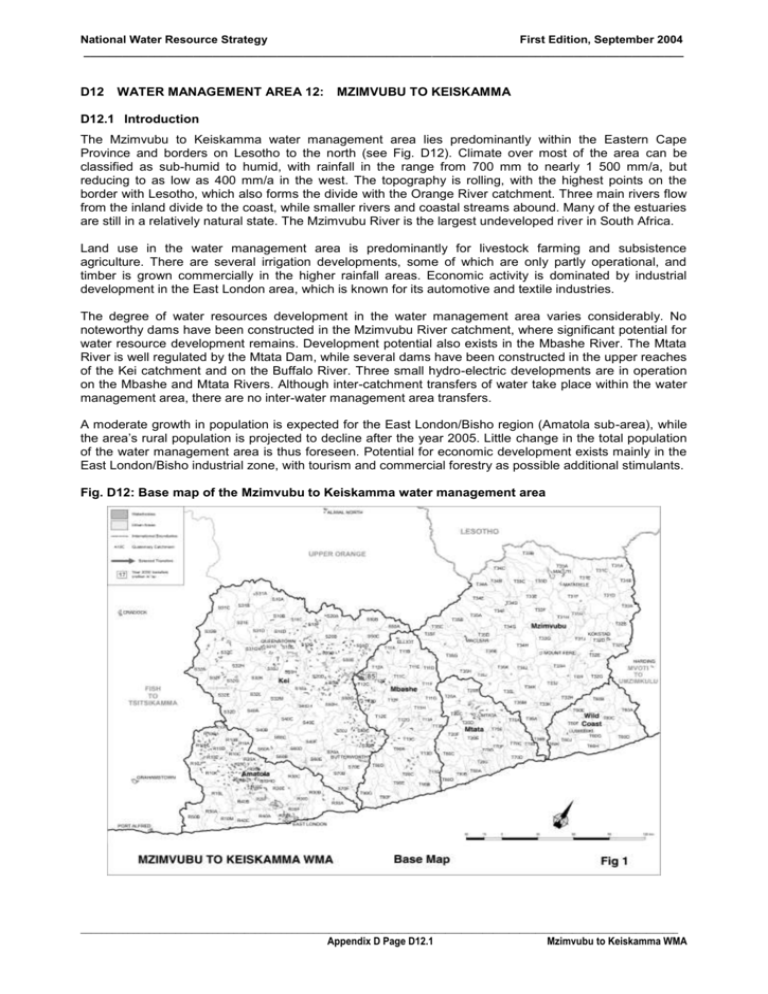
National Water Resource Strategy First Edition, September 2004 _____________________________________________________________________________________________ D12 WATER MANAGEMENT AREA 12: MZIMVUBU TO KEISKAMMA D12.1 Introduction The Mzimvubu to Keiskamma water management area lies predominantly within the Eastern Cape Province and borders on Lesotho to the north (see Fig. D12). Climate over most of the area can be classified as sub-humid to humid, with rainfall in the range from 700 mm to nearly 1 500 mm/a, but reducing to as low as 400 mm/a in the west. The topography is rolling, with the highest points on the border with Lesotho, which also forms the divide with the Orange River catchment. Three main rivers flow from the inland divide to the coast, while smaller rivers and coastal streams abound. Many of the estuaries are still in a relatively natural state. The Mzimvubu River is the largest undeveloped river in South Africa. Land use in the water management area is predominantly for livestock farming and subsistence agriculture. There are several irrigation developments, some of which are only partly operational, and timber is grown commercially in the higher rainfall areas. Economic activity is dominated by industrial development in the East London area, which is known for its automotive and textile industries. The degree of water resources development in the water management area varies considerably. No noteworthy dams have been constructed in the Mzimvubu River catchment, where significant potential for water resource development remains. Development potential also exists in the Mbashe River. The Mtata River is well regulated by the Mtata Dam, while several dams have been constructed in the upper reaches of the Kei catchment and on the Buffalo River. Three small hydro-electric developments are in operation on the Mbashe and Mtata Rivers. Although inter-catchment transfers of water take place within the water management area, there are no inter-water management area transfers. A moderate growth in population is expected for the East London/Bisho region (Amatola sub-area), while the area’s rural population is projected to decline after the year 2005. Little change in the total population of the water management area is thus foreseen. Potential for economic development exists mainly in the East London/Bisho industrial zone, with tourism and commercial forestry as possible additional stimulants. Fig. D12: Base map of the Mzimvubu to Keiskamma water management area _________________________________________________________________________________________________________________ Appendix D Page D12.1 Mzimvubu to Keiskamma WMA National Water Resource Strategy First Edition, September 2004 _____________________________________________________________________________________________ D12.2 Key statistics relevant to the Mzimvubu to Keiskamma water management area Tables D 12.1 to 12.6 contain a breakdown of the information given in Tables 2.1 to 2.6 of Chapter 2 for each sub-area of the Mzimvubu to Keiskamma water management area. Data is derived primarily from the standardised data base. Different information may be available from other sources. Table D12.1: Natural mean annual runoff (MAR) and ecological Reserve (million m³/a) Component/ Sub-area Mzimvubu Ecological Reserve1, 2 Natural MAR1 2 897 338 836 163 Mbashe 1 126 203 Kei 1 027 154 Amatola 559 116 Wild Coast Total for WMA 796 148 7 241 1 122 Mtata 1) Quantities are incremental and refer to the sub-area under consideration only. 2) The total volume is based on preliminary estimates, with impact on yield being a portion of this. Table D12.2: Available yield in the year 2000 (million m³/a) Natural resource Component/ Sub-area Surface water1 Usable return flow Groundwater Irrigation Urban Mining and bulk Total local yield 84 3 2 2 0 91 Mtata 129 1 0 6 0 136 Mbashe 112 1 0 1 0 114 Kei 325 14 14 6 0 359 Amatola 122 1 2 24 0 149 4 1 0 0 0 5 776 21 18 39 0 854 Mzimvubu Wild Coast Total for WMA 1) After allowance for the impacts on yield of the ecological component of the Reserve, river losses, alien vegetation, rain-fed sugar cane and urban runoff. _________________________________________________________________________________________________________________ Appendix D Page D12.2 Mzimvubu to Keiskamma WMA National Water Resource Strategy First Edition, September 2004 _____________________________________________________________________________________________ Table D12.3: Water requirements for the year 2000 (million m³/a) Sector/ Sub-area Urban1 Irrigation Mining and bulk industrial2 0 Rural1 Power Affores- Total local generation3 tation4 requirements 15 6 9 0 3 33 Mtata 4 15 5 0 0 29 53 Mbashe 3 2 6 0 0 0 11 135 18 10 0 0 11 174 33 57 5 0 0 4 99 0 1 3 0 0 0 4 190 99 38 0 0 47 374 Mzimvubu Kei Amatola Wild Coast Total for WMA 1) Includes component of Reserve for basic human needs at 25 ℓ/c/d. 2) Mining and bulk industrial water uses that are not part of urban systems. 3) Includes water for thermal power generation only. (Water for hydropower, which represents a small portion of power generation in South Africa, is generally available for other uses as well.) 4) Quantities refer to the impact on yield only. Table D12.4: Reconciliation of water requirements and availability for the year 2000 (million m³/a) Component/ Sub-area Local yield Transfers in2 Local requirements Transfers out2 Balance1 91 0 33 0 58 Mtata 136 0 53 0 83 Mbashe 114 85 11 0 188 Kei 359 0 174 85 100 Amatola 149 0 99 0 50 5 0 4 0 1 854 0 374 0 480 Mzimvubu Wild Coast Total for WMA 1) Brackets around numbers indicate a negative balance. Surpluses are shown in the most upstream subarea where they first become available. 2) Transfers into and out of sub-areas may include transfers between sub-areas as well as transfers between WMAs. The addition of the quantities transferred per sub-area does therefore not necessarily correspond to the total transfers into and out of the WMA. The same applies to Tables D12.5 and D12.6. _________________________________________________________________________________________________________________ Appendix D Page D12.3 Mzimvubu to Keiskamma WMA National Water Resource Strategy First Edition, September 2004 _____________________________________________________________________________________________ Table D12.5: Reconciliation of water requirements and availability for the year 2025 base scenario (million m³/a) Component/ Sub-area Local yield1 Transfers in Local Transfers Balance3 requirements2 out Potential for development4 1 200 91 0 34 0 57 Mtata 141 0 61 0 80 45 Mbashe 115 85 10 0 190 65 Kei 360 0 179 85 96 135 Amatola 159 0 125 0 34 55 5 0 4 0 1 0 871 0 413 0 458 1 500 Mzimvubu Wild Coast Total for WMA 1) Based on existing infrastructure and infrastructure under construction in the year 2000. Also includes return flows resulting from a growth in requirements. 2) Based on a growth in water requirements as a result of population growth and general economic development. Assumes no general increase in irrigation. 3) Brackets around numbers indicate a negative balance. 4) Based on the construction of a number of dams within the WMA. Table D12.6: Reconciliation of water requirements and availability for the year 2025 high scenario (million m³/a) Component/ Sub-area Local yield1 Transfers in Local Transfers requirements2 out Balance3 Potential for development4 1 200 92 0 35 0 57 Mtata 138 0 54 0 84 45 Mbashe 115 85 10 0 190 65 Kei 362 0 185 85 92 135 Amatola 174 0 161 0 13 55 5 0 4 0 1 0 886 0 449 0 437 1 500 Mzimvubu Wild Coast Total for WMA 1) Based on existing infrastructure and infrastructure under construction in the year 2000. Also includes return flows resulting from a growth in requirements. 2) Based on a high growth in water requirements as a result of population growth and the high impact of economic development. Assumes no general increase in irrigation 3) Brackets around numbers indicate a negative balance. 4) Based on the construction of a number of dams within the WMA. D12.3 Key elements of the broad strategic perspectives for the Mzimvubu to Keiskamma water management area From the reconciliation in Table D12.4 it appears that sufficient yield is available to meet all existing requirements for water. However, with most of the rural and village requirements for water being supplied from unregulated run-of-river yields, implementation of the ecological component of the Reserve may result in the occurrence of dry-season deficits. These will probably manifest themselves as insufficient ecological flows because of preference to be given to basic human needs and are not reflected in the annual average figures in the table. Careful investigation and judicious implementation of the Reserve is therefore required. Similarly, the surplus shown for the Amatola sub-area masks the deficits experienced in the Buffalo River catchment. Serious water quality problems are also experienced along the lower reaches of the Buffalo _________________________________________________________________________________________________________________ Appendix D Page D12.4 Mzimvubu to Keiskamma WMA National Water Resource Strategy First Edition, September 2004 _____________________________________________________________________________________________ River, which are largely attributable to industrial effluent discharges into the river. As the Buffalo River, together with the Nahoon and Kubusi Rivers, are the main sources of water for the important East London/Bisho area, management of both water quantity and quality in the Buffalo River should be a special priority in this water management area. Where deficits are experienced in localised cases, the options described in Section 2.5 for reconciling the requirements for and availability of water should be considered. Other issues that should receive specific consideration are: refurbishment and improved utilisation of irrigation schemes that have fallen into disrepair; and the position with respect to insufficient streamflow measurement in many parts of the water management area. In view of the fact that the Mzimvubu River is the largest undeveloped water resource in the country, the benefits to be derived from the development of this river will potentially be of national importance. It is prudent, therefore, for large-scale development of the Mzimvubu River to be made subject to authorisation at national level. With appropriate planning, new dams for hydropower generation and irrigation, for example, can be located and designed in such a way as to permit the abstraction of water for transfer to other water management areas. The possibility of such future developments of national importance should not be jeopardised unduly by other developments in the interim – reservation with respect to large-scale development of the Mzimvubu River therefore applies to the Mzimvubu to Keiskamma water management area. _________________________________________________________________________________________________________________ Appendix D Page D12.5 Mzimvubu to Keiskamma WMA


