Report P6-2 - Berea College
advertisement
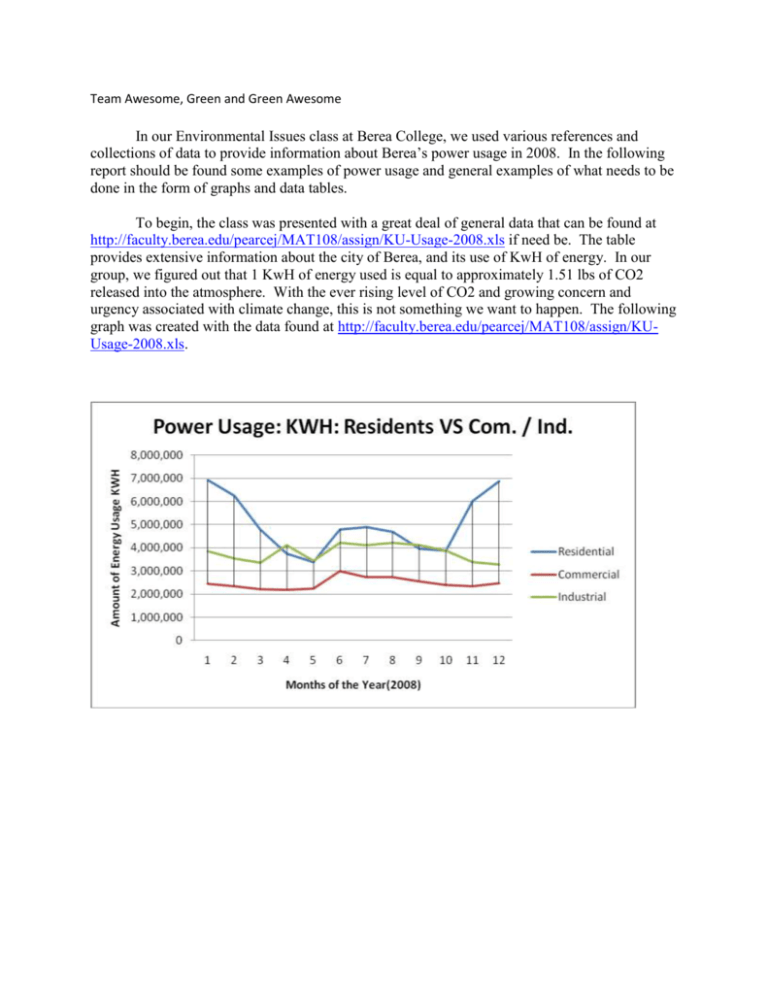
Team Awesome, Green and Green Awesome In our Environmental Issues class at Berea College, we used various references and collections of data to provide information about Berea’s power usage in 2008. In the following report should be found some examples of power usage and general examples of what needs to be done in the form of graphs and data tables. To begin, the class was presented with a great deal of general data that can be found at http://faculty.berea.edu/pearcej/MAT108/assign/KU-Usage-2008.xls if need be. The table provides extensive information about the city of Berea, and its use of KwH of energy. In our group, we figured out that 1 KwH of energy used is equal to approximately 1.51 lbs of CO2 released into the atmosphere. With the ever rising level of CO2 and growing concern and urgency associated with climate change, this is not something we want to happen. The following graph was created with the data found at http://faculty.berea.edu/pearcej/MAT108/assign/KUUsage-2008.xls. If we are going to try to cut down on our energy usage, we need to first know where the energy is going. The first option might be to lower the amount of electricity used by residential locations, since that is the section that uses the most electricity. Although residential settings use much more than commercial and industrial, one must keep in mind that there are over 3,600 more residents than commercial and industrial groups together. According to Electricity Usage in Berea (Chart 1), based off of the information sent to Dr. Jan Pearce by the manager of Berea Municiple Utilities, industries use significantly more electricity than businesses and residents combined. In fact, when broken down to individual businesses, industries, and residents; industries use nearly 95 percent of all electricity used in Berea (2008). Figure 1: Sources of Power from Berea Municipal Utilities Carbon Emissions from different energy sources Carbon Emissions from a comparable town with less coal/more clean energy As you can see from the graph above in figure 1, the majority of Berea’s power comes from coal. This is important to look at because it correlates with a significant amount of carbon dioxide emissions, whereas hydroelectric power or other renewable sources would emit much carbon dioxide at all. Hydro, Oil, Gas, and Non Hydro Renewables collectively make up less than 15% of our total energy sources. This tells us that we depend heavily upon coal when there are other sources to be used. It is also important because nuclear power is the second highest source of power within this company. Along with carbon emissions, nuclear power brings with it nuclear waste, which is also harmful for the environment. Because so much of the power is from coal, there needs to be ways in which we can begin to offset these harmful effects; one of the possible offset options is to plant acres of trees. The information regarding the proportions of sources of power is from the EPA website (How Clean is the electricity I Use). Figure 3: Emissions of different types of Berea Municipal Utility customers As shown in figure 3, the highest producers of carbon dioxide emissions are the industries that are located within Berea (KU-Usage-2008). Each industry within Berea roughly produces a little over a million pounds of carbon dioxide per year. Note that this is each industry individually, not all of them as a whole, which is even more alarming (KU-Usage-2008). Although there are only 53 of them, they are producing around 94% more per commercial customer. The industries have such a larger amount of pounds of carbon dioxide emitted is due to inefficiencies within the system in regard to how the power itself is transferred (Donald Blackburn). There are large amounts of greenhouse gas emissions coming from the Berea area, including sulfur dioxide, nitrogen oxide, and carbon dioxide. The amount of carbon dioxide that is emitted is astonishing. For every megawatt of electricity generated, over 1,500 pounds of carbon is emitted into the atmosphere (“Sample Power Profiler Report”). Carbon combines with oxygen to create carbon dioxide, which then contributes to the problem of human-caused climate change. Berea released about 2.04x10¹⁴ pounds of CO2 (Chart 2) into the atmosphere last year. That’s about 2,040 trillion pounds, or 2,040,000,000,000,000 lbs. This number is extremely shocking. However, if the citizens of Berea know how the electricity use is divided, they can make changes in the areas which consume the most power (and therefore emit the most carbon). Therefore, the best area to cut down on electricity usage would be within the industries. Figure 2: Comparison of the size of Berea in acres and the number of acres it would take to offset Berea’s carbon dioxide emissions. As shown above in figure 2, Berea is made up of around 6,016 acres of land (Berea, KY). Though Berea is a small town, it releases a very large amount of carbon dioxide. To offset the carbon emissions in Berea, it would be necessary to have more acres of trees in the city. There is a problem here; this dramatic bar difference is presented so that the audience can clearly recognize the problem we are facing. As you can see, we are in need of more acres than is available for Berea’s carbon emission to be completely offset, thus neutralizing the city’s harm to the environment. This simply is not possible. 1.35 acres of trees offsets about 10,000 pounds of carbon dioxide emissions (Sample Power Profiler Report). This also means that Berea has emitted 204,274,074 pounds of carbon dioxide. The most effective way of reducing our carbon dioxide emissions is to examine which sources are the heaviest emitters, and then examine how we can encourage beneficial change. It is evident while looking over these figures and statistics that the energy industry in Kentucky needs to change. It is very irresponsible to emit so much carbon dioxide into the atmosphere when we do not even have the resources to offset those effects, as shown in figure 2. Coal represents 67% of our total energy resources, and from that coal millions of pounds of carbon dioxide are also produced, as shown in figure 1. From this we can begin to discern what change is crucial for Berea’s sustainability. Those are: balance in different power sources, decrease in carbon emission, and applying these first of all to the Berea Industries. If these actions are not taken, the results will be significantly detrimental. Works Cited Blackburn, James. Message to Jan Pearce. 5/11/2009. E-mail. "Berea Municipal Utilities." All Business: A D&B Company N.p., n.d. Web. 17 Nov. 2009. <http://www.allbusiness.com/companyprofile/Berea_Municipal_Utilities/98AB688989EDE3D30 28F9BAD8E2B125A-1.html>. "Berea, KY." Wikipedia Wikipedia, 2009. Web. 17 Nov. 2009. <http://en.wikipedia.org/wiki/Berea,_KY>. "Sample Power Profiler Report." Sample Power Profiler Report EPA, 2000. Web. 17 Nov. 2009. <http://www.epa.gov/cleanenergy/energy-and-you/report-large.html>. KU-Usage-2008 Excel File. "Carbon Sequestration." Wikipedia. 2009. Web. <http://en.wikipedia.org/wiki/Carbon_sequestration>. EPA. "Power Profiler, How Clean is the Electricity I Use?." Environmental Protection Agency (2007): n. pag. Web. 16 Nov 2009. <http://www.epa.gov/cleanenergy/energy-and-you/report-large.html>.

