PS_6
advertisement
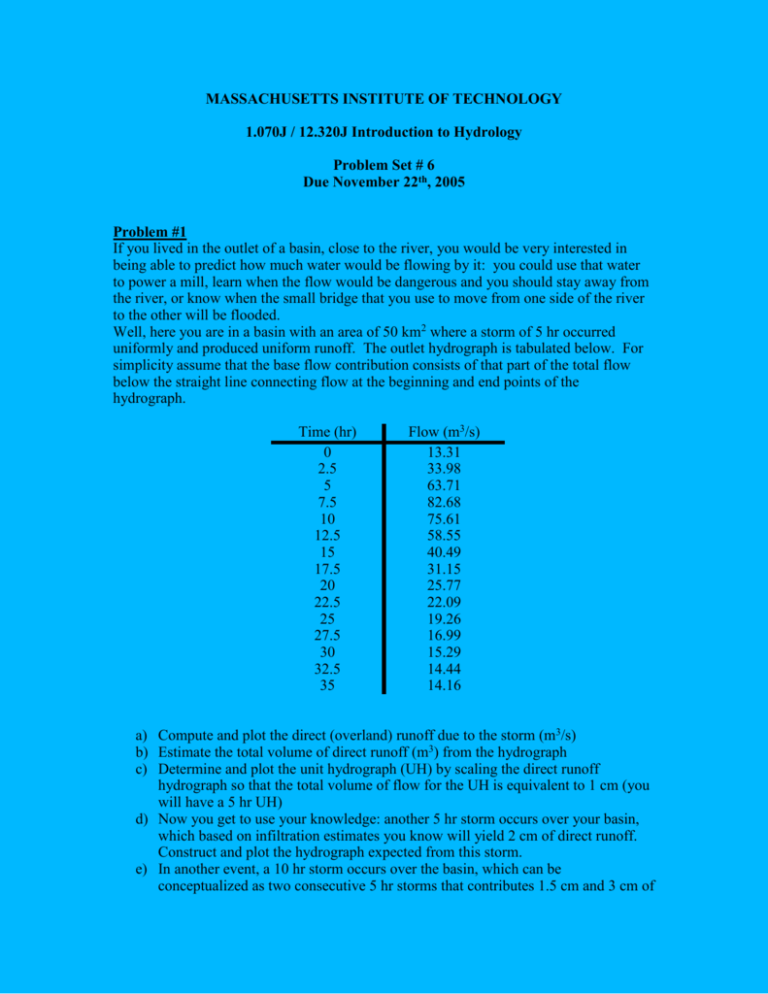
MASSACHUSETTS INSTITUTE OF TECHNOLOGY 1.070J / 12.320J Introduction to Hydrology Problem Set # 6 Due November 22th, 2005 Problem #1 If you lived in the outlet of a basin, close to the river, you would be very interested in being able to predict how much water would be flowing by it: you could use that water to power a mill, learn when the flow would be dangerous and you should stay away from the river, or know when the small bridge that you use to move from one side of the river to the other will be flooded. Well, here you are in a basin with an area of 50 km2 where a storm of 5 hr occurred uniformly and produced uniform runoff. The outlet hydrograph is tabulated below. For simplicity assume that the base flow contribution consists of that part of the total flow below the straight line connecting flow at the beginning and end points of the hydrograph. Time (hr) 0 2.5 5 7.5 10 12.5 15 17.5 20 22.5 25 27.5 30 32.5 35 Flow (m3/s) 13.31 33.98 63.71 82.68 75.61 58.55 40.49 31.15 25.77 22.09 19.26 16.99 15.29 14.44 14.16 a) Compute and plot the direct (overland) runoff due to the storm (m3/s) b) Estimate the total volume of direct runoff (m3) from the hydrograph c) Determine and plot the unit hydrograph (UH) by scaling the direct runoff hydrograph so that the total volume of flow for the UH is equivalent to 1 cm (you will have a 5 hr UH) d) Now you get to use your knowledge: another 5 hr storm occurs over your basin, which based on infiltration estimates you know will yield 2 cm of direct runoff. Construct and plot the hydrograph expected from this storm. e) In another event, a 10 hr storm occurs over the basin, which can be conceptualized as two consecutive 5 hr storms that contributes 1.5 cm and 3 cm of direct runoff respectively (Note: as we know, infiltration goes down with time over the course of a storm, which causes this corresponding increase in runoff over time). Construct and plot the hydrograph expected from this storm. As an extra-credit question: What would the advantages of having a 1hr UH be? Problem #2 You are now a researcher and rarely go to the field, but from data you have collected you approximate the instantaneous unit hydrograph of a monitored basin as h(t ) e t where λ = 0.2 1/hr. You then want to simulate the flow at the outlet for your biologist friends who want to understand better the flow regime of the river at the outlet of the basin because they think that it determines the type of plants growing there. You have also found that the intensity of rainfall storms in this basin can be represented with this equation: i (t ) io e t where io and α are storm parameters. If for a particular storm io = 3 mm/hr and α = 0.5 1/hr, and all the rainfall runs off (assuming there is no infiltration) what would be the basin outflow hydrograph (Q(t)) as a function of time? a) Find Q(t) b) Plot i(t), h(t) and Q(t), and explain why the time base differs fro each. Problem #3 The Muskingum method for flow routing allows you to estimate how the inputs and outputs of the section of a river interact. This method makes use of two parameters, K and x. You want to understand better what these parameters may represent, what may their meaning be. For that you will use the following hydrograph of the flow input into a stream segment (where the base flow is 1 m3): Time (hr): 0 Inflow (m3/hr): 1 1 6 2 30 3 60 4 42 5 24 6 12 7 7 8 1.5 9 1 Plot this upstream (input) hydrograph and compute and plot the downstream outflow hydrograph for the river reach, assuming the following Muskingum parameters: a) K = 1 hr b) K = 1 hr c) K = 5 hr x = 0.2 x=0 x = 0.2 Explain the effect of changing K and x on the downstream hydrograph Problem #4 Imagine a river basin in which every stream link has two upstream links. This, of course is an idealized basin, but you may be surprised by how well it agrees with real basins. a) Define the bifurcation ratio for such a basin b) If each stream link has a unit length of 1 mile, derive in closed form what would be the total channel length of streams for a basin of order 52. c) If this basin preserves geometrical similarity, what is the relationship that defines the area of basin order 52? Plot and compare this to what is actually observed. Make the plot in Km and Km2.
