Modern Studies of the H2 + O2 Reaction in Flow Reactors
advertisement
CHEM3210: Chemical Kinetics of Complex Systems
Professor S.K. Scott
Lecture 6: The H2 + O2 and CO + O2 Reactions in Flow Reactors
6.1 H2 + O2 reaction in a closed reactor
The spontaneous combustion reaction between hydrogen and oxygen is one of the
fundamental building blocks of modern combustion kinetics.
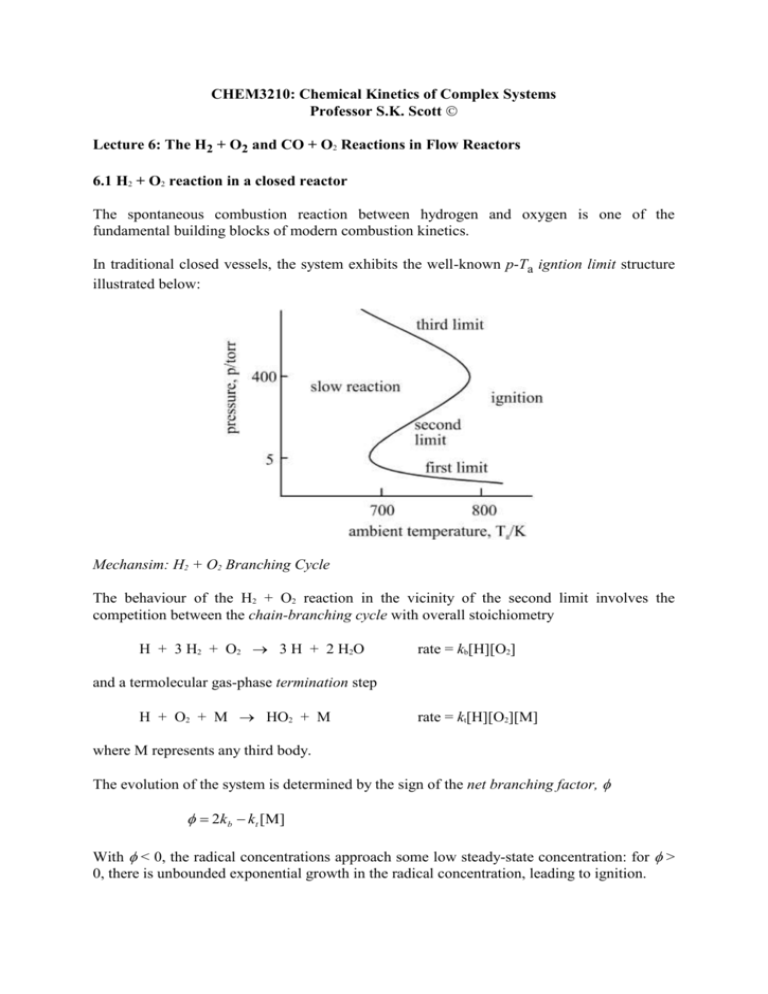
In traditional closed vessels, the system exhibits the well-known p-Ta igntion limit structure
illustrated below:
Mechansim: H2 + O2 Branching Cycle
The behaviour of the H2 + O2 reaction in the vicinity of the second limit involves the
competition between the chain-branching cycle with overall stoichiometry
H + 3 H2 + O2 3 H + 2 H2O
rate = kb[H][O2]
and a termolecular gas-phase termination step
H + O2 + M HO2 + M
rate = kt[H][O2][M]
where M represents any third body.
The evolution of the system is determined by the sign of the net branching factor,
2kb kt [M]
With < 0, the radical concentrations approach some low steady-state concentration: for >
0, there is unbounded exponential growth in the radical concentration, leading to ignition.
The condition corresponding to the ignition limit is = 0, which can be written as
2kb (Tcr ) kt ( pcr / RT )
linking the critical temperature and pressure.
6.2 Studies of the H2 + O2 reaction in a CSTR
The advantages of studying the same system in a continuous flow reactors include (a) the
‘slow reaction’ to the left of the limits, in which significant self-heating may develop,
becomes a truly steady-state response and, (b) the kinetic behaviour on the ‘ignition’ side of
the limits can be investigated over more than a millisecond timescale.
The H2 + O2 system shows similar p-Ta limits in a CSTR. For an equimolar mixture of the
reactants, the ignition limit diagram has the following form in the vicinity of the second limit:
For conditions to the right of the limit, reaction corresponding to ignition can have one of two
forms: a steady ignited state or an oscillatory ignition. The latter occurs in a region bounded
by a second boundary, as indicated.
Oscillatory waveform: relaxation ignitions
Within the oscillatory ignition region, and for ambient temperatures not too far in excess of
the limit, the oscillations have a typical ‘relaxation’ waveform. Typical experimental traces
showing the variation in self-heating (due to the exothermic reaction), in emitted light
intensity and, in the concentrations of the reactant O2 and product H2O are shown below:
The waveform is characterised by a sharp ‘ignition’ spike followed by a period of virtually no
reaction during which the reactant concentration is re-established and the product
concentration falls essentially due to flow alone.
6.3 Descriptive account of oscillatory mechanism
To understand the origin of the oscillations, we need to acknowledge that the termination step
controlling radical removal has a rate that depends on the instantaneous mixture composition.
This is because different species have different third body efficiencies in stabilising the HO2
adduct through energy transfer. As is turns out, the product H2O is particularly efficient in this
process, being approximately 6 times as efficient as H2 and twenty time as efficient as O2. We
can express this composition dependence by writing the net branching factor in the following
form:
2kb (T ) ktH2 xH2 aO2 xO2 aH2O xH2O ( p / RT )
where the xi are the instantaneous mole fractions and the ai are the relative third body
efficiencies (taken relative to H2) for the different species in the reacting mixture. The
relevant values are aO2 0.3 and a H 2O 6.3
For p-Ta conditions to the left (lower temperature, higher pressure) of the second limit, the net
branching factor is negative, so a low steady-state radical concentration is established. Little
reaction will be occurring in this steady state, so the concentrations of the reactants H2 and O2
will be close to their inflow concentrations, and the concentration of the product H2O will be
close to zero. The appropriate net branching factor is thus that evaluated for the inflow
composition.
If we increase Ta or decrease p, so as to cross the limit, the value of the net branching factor
based on the inflow composition becomes positive. This causes the radical species
concentration to increase and an ignition ensues.
Accompanying the ignition, the mole fractions of H2 and O2 fall according to the reaction
stoichiometry and the relative concentrations of these two species in the inflow. The
concentration of the product increases.
For p-Ta conditions not too far above the limit, the value of the net branching factor evaluated
for the product mixture composition will be negative, due to the enhancement of the
termination step through the greater efficiency of the product. This change in sign of , causes
the combustion reaction to ‘switch off’.
In a closed system, this signifies the end of the reaction. In a flow system, however, the
concentrations of the reactants are now able to recover due to the inflow of these species,
whilst the concentration of the product will decrease once its chemical rate of production has
fallen, due to the outflow.
The high concentration of the inhibitor H2O effectively prevents any reaction during this
stage, so after the ignition spike, the dynamics of the CSTR are essentially those of an inert
system subject to an inflow of H2 and O2 and an outflow of H2O.
As [H2O] falls and [H2] and [O2] increase, so the termination process becomes less efficient
and the net branching factor increases again. As it passes through zero, a second ignition can
develop and the mixture composition changes almost discontinuously back to the product
composition.
If we are only just across the limit, the value of 2kb will be only marginally greater than the
value of the termination rate term evaluated for the inflow composition: thus the exponential
terms in the above equation have to decay almost to zero, i.e. we have to wait many residence
times, before becomes positive again and the next ignition can occur.
As the ambient temperature is increased substantially above the ignition limit, so can
become positive even with a significantly non-zero water concentration – the exponential
terms do not have to fall to such low values and the concentrations of the reactants do not
recover to close to their inflow concentrations before the next ignition.
If Ta is sufficiently high, the value of the branching rate term will be such that it exceeds even
the value of the termination rate term corresponding to complete conversion of the reactants
to the inhibitor water. The production of the product is not enough to make and so there is
no quenching of the ignited state – we loose oscillatory behaviour and get a steady flame.
6.4 Complex oscillations and chaos in the CO + O2 reaction.
The spontaneous reaction between CO and O2 is the ‘other’ stoichiometrically-simple
combustion process, and is of great importance as representing the final stage of oxidation to
CO2 of any hydrocarbon fuel.
The use of flow reactors, combined with careful control of the H-content of the reactants,
allows the investigation of transient phenomena in batch under truly sustained operation.
Also, with careful attention to experimental procedure, the sensitivity of this reaction system
to the ‘ageing’ of the reactor surface condition appears to be alleviated.
For systems with ca. 0.5% H2 added to the CO stock gas, the p-Ta diagram has the form given
below:
There is a ‘second ignition limit’ separating slow steady reaction from an oscillatory ignition
state - although the latter terminology needs slight qualification: during an ‘ignition’ a
fraction of the CO fuel is consumed, but not necessarily all of it; it appears that all the H 2
present reacts completely during an ‘ignition’.
At highest Ta, a steady high reaction state is observed: this has a steady chemiluminescence.
Within the oscillatory ignition region is a sub-region of more complex oscillations.
Period-doubling
The general nature of the bifurcation sequences between states of varying complexity as we
traverse the shaded region of the p-Ta diagram can be gauged by simply allowing the ambient
temperature to increase slowly so as to follow one of the two paths indicated by the dashed
lines on the diagram.
For the path at high pressure, the response is indicated below:
The oscillatory ignition has a standard period-1 type waveform, with each repeating unit
comprising a single peak and each oscillation having the same amplitude and period as the
previous one. As we enter the region of complex behaviour, so the waveform changes,
adjusting to one in which alternate oscillations are large and small in amplitude. The period
between any given peak and the next is approximately the same as for the previous period-1
response, but now the repeating unit comprises two peaks (large + small) and to the
oscillatory period is double that of the period-1 state. This is called a period-doubling
bifurcation.
No higher periodicity is encountered in this scan: at higher Ta, the oscillation makes a
transition back to a period-1 state (now with a ‘small’ amplitude) and, at even higher Ta, this
undergoes a Hopf bifurcation to yield a stable steady state.
Higher periodicities
At lower pressures, the region of complex oscillations is somewhat wider: allowing the
system to develop higher degrees of oscillatory complexity. A scan through this region under
such conditions is given below:
Again, we first encounter period-1 oscillations of relatively large amplitude, and this state
undergoes a period-doubling bifurcation to a period-2 (large + small amplitude) state at
higher Ta.
As the ambient temperature increases further, there is a subsequent transition to a period-4
state, which develops as a ‘doubling’ from the period-2 state. This is then followed by a very
complex response, before we return to period-4, period-2 and period-1 through a periodhalving sequence.
Sustained responses
To determine the actual (post transient) response under any particular operating conditions,
we must allow the ambient temperature to settle to a constant value for sufficiently long
before data capture.
Six such stable responses are given below:
In (a) a period-1 response is established. At a slightly higher ambient temperature, the system
exhibits a sustained period-2 response, (b), with one large and one small peak. Trace (c)
corresponds to a period-4 state. Evidence for subsequent period-8 and period-16 states at
higher Ta have also been collected, but the range of experimental conditions over which a
given type of response is observed decreases rapidly as the complexity increases, so these are
increasingly hard to maintain for substantial periods experimentally.
For a finite range of operating conditions beyond the period 2n states, we find a complex
response with no apparent periodicity of the type illustrated in figure (d). We will return to an
analysis of this trace soon, but note first that within the range of conditions for which this
response is found, there are small ‘windows’ of periodicity that are encountered. A period-5
and a period-3 state observed in two such windows are shown in (e) and (f) respectively.
6.5 Chaotic behaviour
The trace in (d) above is of a most complex response. Although there is no apparent repeating
unit, this is no random evolution. To illustrate the existence of an underlying set of rules
(determinism) governing the evolution of this system, we can construct a next maximum map.
This plots the height of one peak, for instance as measured by the thermocouple, against the
height of the next peak through a sequence of such maxima.
The next maximum map revealed for the CO + O2 system shows a classic ‘single-humped
maximum’ shape. This is characteristic of a large class of dynamical systems, which all show
the same qualitative bifurcation sequences.
The simplest realisation of a single-humped maximum map is the recursive relationship or
logistic map
xn 1 Axn (1 xn )
which has been widely studied.
Characteristic features of chaotic evolution
An important feature of a chaotic system relates to the sensitivity of such a system to the its
initial conditions.
For more ‘regular’ responses, common experience is that experiments are essentially
repeatable: any small differences reflecting the difference in the initial state two systems
under identical operating conditions usually decrease in time - perhaps only persisting as a
long-time difference in phase. To paraphrase Einstein, apart from some statistical noise, the
‘same’ systems give the ‘same’ behaviour.
For chaotic systems this is not the case. Two systems with identical operating conditions but
with a minor difference in initial conditions may show a similar evolution in their early
stages, but this initial difference will be amplified by the nonlinear behaviour of the reacting
system and will grow exponentially in time. Eventually, there will be no correlation between
the two systems.
This feature also means that it is impossible to predict the long-time behaviour of a system
evolving chaotically - even if we know the exact equations governing the system. Short-term
prediction may be possible, within certain tolerances of uncertainty, but nothing in the long
term - even though it is a deterministic system.
{We should, however, note that the above does not mean that we cannot accurately predict if
a system will be chaotic: we can, in fact, find the operating conditions under which the system
is chaotic with arbitrary precision (provided we know the governing equations) and if one
system is chaotic under those conditions, so will be a second system under the same operating
conditions. The chaotic nature of the response is predictable and repeatable: the details of the
evolutions of the concentration and temperature in time for a chaotic system are not.}

