MODULE 25
advertisement
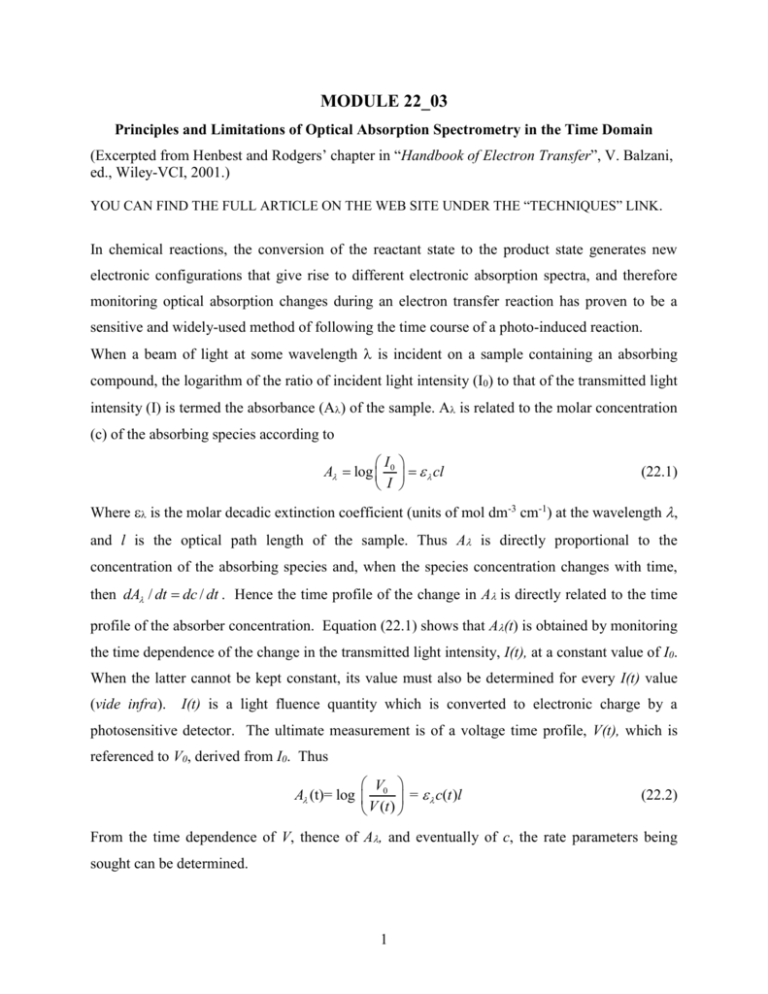
MODULE 22_03 Principles and Limitations of Optical Absorption Spectrometry in the Time Domain (Excerpted from Henbest and Rodgers’ chapter in “Handbook of Electron Transfer”, V. Balzani, ed., Wiley-VCI, 2001.) YOU CAN FIND THE FULL ARTICLE ON THE WEB SITE UNDER THE “TECHNIQUES” LINK. In chemical reactions, the conversion of the reactant state to the product state generates new electronic configurations that give rise to different electronic absorption spectra, and therefore monitoring optical absorption changes during an electron transfer reaction has proven to be a sensitive and widely-used method of following the time course of a photo-induced reaction. When a beam of light at some wavelength is incident on a sample containing an absorbing compound, the logarithm of the ratio of incident light intensity (I0) to that of the transmitted light intensity (I) is termed the absorbance (A) of the sample. A is related to the molar concentration (c) of the absorbing species according to I A log 0 cl I (22.1) Where is the molar decadic extinction coefficient (units of mol dm-3 cm-1) at the wavelength , and l is the optical path length of the sample. Thus A is directly proportional to the concentration of the absorbing species and, when the species concentration changes with time, then dA / dt dc / dt . Hence the time profile of the change in Ais directly related to the time profile of the absorber concentration. Equation (22.1) shows that A(t) is obtained by monitoring the time dependence of the change in the transmitted light intensity, I(t), at a constant value of I0. When the latter cannot be kept constant, its value must also be determined for every I(t) value (vide infra). I(t) is a light fluence quantity which is converted to electronic charge by a photosensitive detector. The ultimate measurement is of a voltage time profile, V(t), which is referenced to V0, derived from I0. Thus V A (t)= log 0 = c(t )l V (t ) (22.2) From the time dependence of V, thence of A, and eventually of c, the rate parameters being sought can be determined. 1 The determined absorbance depends on two variables, namely time and wavelength. The time dependence leads to dynamics information as outlined above; the wavelength dependence provides spectral information, useful for assignment or structural purposes. Obtaining values of A(,t) for a photo-initiated sample enables a dynamic surface (A--t) to be constructed which contains the totality of the information available from an optical absorption experiment. Two distinct types of experiment have been employed to generate A(,t) data for transient species. One is a continuous recording method in which a photo-detector such as a photodiode or a photomultiplier tube (PMT) monitors the intensity of the transmitted light through the sample at fixed wavelength ( in a continuous manner, before, during, and after the initiating light pulse. The detector output is fed to the input amplifier of a waveform-recording device such as a digital oscilloscope, which acquires the waveform and stores it for eventual processing. Thus recording of the V(t) profile is done in real time. Repeating the process over a series of wavelengths allows the investigator to build up the dynamic surface for the light-induced transient, which is, in principle capable of providing rate data at different wavelengths and timedependent spectra. In what follows this type of experiment will be referred to as the continuous photoelectric method. The photoelectric method is excellent for providing kinetic information since the time profiles from a single experiment arrive at the digitizer as analog voltage waveforms that can be digitized into as many bits of information as required. This lends itself to highly precise determinations of rate parameters. The same is not true of the spectral information, which is taken point-by-point, and the number of points taken, and hence the precision of the obtained spectrum will to some extent depend on the investigator's patience. As pointed out in a later Module, this last difficulty can be improved by employing a spectrographic recording method. The major limitation of photoelectric recording is what can be thought of as the nanosecond barrier. This limitation arises because of the intrinsic time response of the electronic devices that must be used to acquire and process the photon-generated cathode current of the PMT or photodiode. All such devices have impedance and even the best-designed circuitry has stray capacitance of typically 20 pF which, when combined with the 50 industry-standard of high bandwidth electronic amplifiers, yields a RC time constant of 1 ns. Hence instruments that are 2 built up from conventional electronic units will have minimum rise times in the ns region and therefore chemical changes that have lifetimes less than 5 ns, say, will be severely deformed. Of course other reasons may intervene (e.g.10 ns wide laser pulses) that make the instrument response even poorer than implied by the nanosecond barrier. It is important to find a way around the nanosecond barrier problem if reactions occurring in the sub-nanosecond regime are to be investigated, and the pump-probe method provides the path. Here, two light pulses are generated; one to excite the sample (prepare the reactant state) and one to probe the system at a given time post-excitation. The early experiments used high-energy flash lamps for generating observable concentrations of short-lived species and lower energy flash sources as interrogating beams. The two flashes were electronically delayed, one with respect to the other. This procedure stems from the methodology employed by Norrish and Porter in 1949 as part of their invention of the technique of flash photolysis which led to their being awarded the Nobel Prize in Chemistry in 1967 and which revolutionized the study of short-lived transient species inasmuch as it proved capable of generating and analyzing chemical species with lifetimes shorter than a few milliseconds.1,2 In the modern era flash lamps have been superceded by pulsed laser sources, which are monochromatic, highly collimated, and have a much higher repetition rate. Using a single laser source, the probe pulse can be a small amount split from the main pump beam, and therefore of the same wavelength. Such an arrangement is restricted to measuring the kinetics of repopulation of ground state absorption removed (bleached) by the pump pulse. This method has been fruitfully employed in several laboratories.3-6 Significantly more information is available when the probe pulse is a white light continuum. Such a continuum can be generated by self phase modulation in which a minor fraction of the pump beam is split off and focused into a transparent medium such as a stream of liquid or a piece of crystal. Footnote: it is interesting to note that some 50 years after Norrish and Porter’s 1949 Nature paper 15 that reported the development, Ahmed Zewail was awarded the 1999 Nobel Prize in Chemistry for using Norrish-Porter concepts on the femtosecond time scale to investigate the transition state domain 3 In this case a spectrograph is used to disperse the spectral distribution of the probe beam transmitted by the sample, and an array detector is employed to record the wavelength distribution of transmitted intensity. Under these conditions one obtains an absorption spectrum of transient species formed, or ground state species removed by the initiating pulse. This spectrum will be registered at a time that is given by the difference in arrival times at the sample of the pump and probe pulses and it will be an average over the temporal width of the probe pulse. Instead of obtaining spectral information using a spectrograph-array combination, one can employ a probe beam of a selected, but changeable wavelength. Such a beam can be isolated from a continuum source by one of a set of interference filters; or it can be generated by an optical parametric amplifier which can be scanned to provide spectral coverage.57,58 In both these instances the detector can be a commonplace photodiode. Repeating the experiment with different filters, or with the OPA set at a sequence of output wavelengths, results in spectral resolution. Repetition of the spectrum acquisition sequence at different probe pulse arrival times provides a series of spectra delayed with respect to each other. Thus time resolution of the reaction is achieved in a point-by-point manner, whence the intensity-time-wavelength surface can be produced. In this pump-probe type of experiment the detector of the transmitted probe light behaves as a photon integrator only and the time resolution derives from the instrument’s capability for measuring the difference in the time of arrival of the pump and probe pulses. This capability provides an intrinsic limitation to the pump-probe method, which depends critically on the width of the pulses being employed. However, exceedingly short duration pulses are commonplace these days. A more practical limitation to this method involves the regime of large time differences. When a single laser is used as the source of both pump and probe pulses the time difference is generated by delaying the probe with respect to the pump with an optical delay line. Such devices are excellent for delays in the sub-ns region and up to 3 ns or so, but become very cumbersome to 4 align and operate for delay times in excess of 10 ns or so, and are rarely used in this regime. Investigators have used a pair of individual light sources for the longer delays. Thus Porter and his colleagues in their original microsecond experiments used a pair of flash lamps, one to pump and one to probe.1,7 More recently others have employed two Q-switched lasers to generate delays in the long ns region 8,9 especially where spectra and not kinetic profiles are being sought. In the above development nothing has been stated about the analytical wavelength region employed in photoelectric spectrometry or pump-probe spectrometry. In fact most of the work carried out to date centers on the uv-visible wavelength region although there is increasing activity among the research community in exploring the mid-infrared (fingerprint) region. More detail about actual experimental set-ups will be found in a later Module. References (1) R. G. W. Norrish, G. P. Nature 1949, 164, 658. (2) G. Porter, M. A. W. In;; Hammes, G. G., Ed.; Wiley Interscience: New York, 1974; Vol. Vol. 6, 3rd. Ed. (3) E. P. Ippen, C. V. S., A. Bergman Chem. Phys. Lett. 1978, 38, 611. (4) T. Gillbro, V. P. S. In Picosecond Phenomena III; K. B. Eisenthal, R. M. H., W. Kaiser, A. Laubereau, Ed.; Springer-Verlag: Berlin, 1982; p 315. (5) K. G. Spears, T. H. G., D. Huang In Picosecond Phenomena III; K. B. Eisenthal, R. M. H., W. Kaiser, A. Laubereau, Ed.; Springer-Verlag: Berlin, 1982; p 278. (6) T. J. Chuang, G. W. H., K.B. Eisenthal Chem. Phys. Lett. 1974, 25, 201. (7) G. Porter, M. A. W. Proc. Roy. Soc., London 1950, A200, 284. (8) J. C. Scaiano, L. J. J. In Organic Photochemistry; Padwa, A., Ed.; Marcel Dekker: New York, 1989; Vol. 10, p p. 309. (9) R. M. Wilson, K. A. S. Chem. Rev. 1993, 93. 5

