RC time constant lab
advertisement
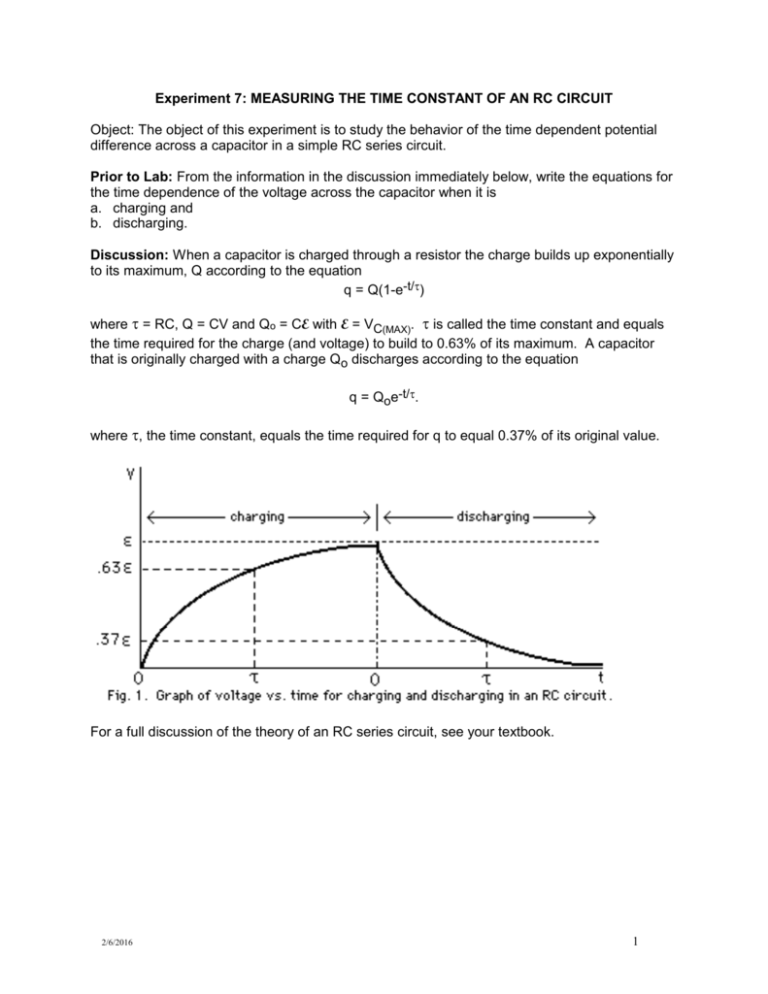
Experiment 7: MEASURING THE TIME CONSTANT OF AN RC CIRCUIT Object: The object of this experiment is to study the behavior of the time dependent potential difference across a capacitor in a simple RC series circuit. Prior to Lab: From the information in the discussion immediately below, write the equations for the time dependence of the voltage across the capacitor when it is a. charging and b. discharging. Discussion: When a capacitor is charged through a resistor the charge builds up exponentially to its maximum, Q according to the equation q = Q(1-e-t/) where = RC, Q = CV and Qo = CE with E = VC(MAX). is called the time constant and equals the time required for the charge (and voltage) to build to 0.63% of its maximum. A capacitor that is originally charged with a charge Qo discharges according to the equation q = Qoe-t/. where , the time constant, equals the time required for q to equal 0.37% of its original value. For a full discussion of the theory of an RC series circuit, see your textbook. 2/6/2016 1 The circuit provided has a large enough time constant that data may be taken using a timer and voltmeter. The data can then be graphed, and the shape of the graph and value of the time constant may then be investigated. The time constant can then be compared to the theoretical value obtained by computing RC from the resistor and capacitor used to perform the experiment. V C + R 2 1 S E Figure 1. Wiring diagram for charging and discharging an electrolytic capacitor (C) in and RC circuit. V is the voltmeter. Switch (S) in position 1 is for charging and switch in position 2 is for discharging. Figure 2. The apparatus wired as according to the wiring diagram on the left. An additional (white) wire is attached between the capacitor and resistor to speed up the experiment. PROCEDURE: 1. Wire the circuit according to the diagram provided in Figure 1. Warning: Pay particular attention to the polarity of the wiring, you are using an electrolytic capacitor which, if wired backwards will leak a measurable current (you will get an incorrect result) and may be damaged! Your instructor will check your circuit and set the source voltage to 10 volts. 2. Discharge the capacitor (short circuit it). 3. Simultaneously start the timer and close the switch (position 1) to complete the charging circuit. Keep the switch closed, and record voltages every 10 seconds for at least 2.0 time constants (200 seconds). 4. When you are finished taking data, short circuit the resistor to fully charge the capacitor to E. Record this value. 5. Simultaneously start the timer and close the switch (position 2) to complete the discharging circuit. Keep the switch closed, and record voltages every 10 seconds for at least 2.0 time constants (200 seconds). (NOTE: The voltage at t = 0 will be the initial voltage for discharging the circuit.) 6. Repeat steps 2 through 5 at least once more. 2/6/2016 2 7. Analysis a. Charging data: Plot a graph of V vs. t. Calculate VC(MAX) - V. Plot a second graph of (VC(MAX) – V) vs. t and determine the exponential trendline of the second graph to determine E and the time constant . b. Discharging data: Plot a graph of V vs. t. Determine the exponential trendline of the graph to determine E and the time constant . 8. Do an instrumental error analysis to determine the uncertainty of your measured value of E. Is the setting of the power supply within the range determined by E E? 9. Compare with the product of RC for your apparatus with the measured value of for your experiment. Include the uncertainty of the product RC using the manufacturer’s tolerances for the values of R and C. The manufacturer’s tolerances are 10% for R and C. Is your measured time constant within the range of the uncertainty you calculated? 10. Discuss any sources of error in your conclusion. 2/6/2016 3
![Sample_hold[1]](http://s2.studylib.net/store/data/005360237_1-66a09447be9ffd6ace4f3f67c2fef5c7-300x300.png)
