Radioactive Decay
advertisement
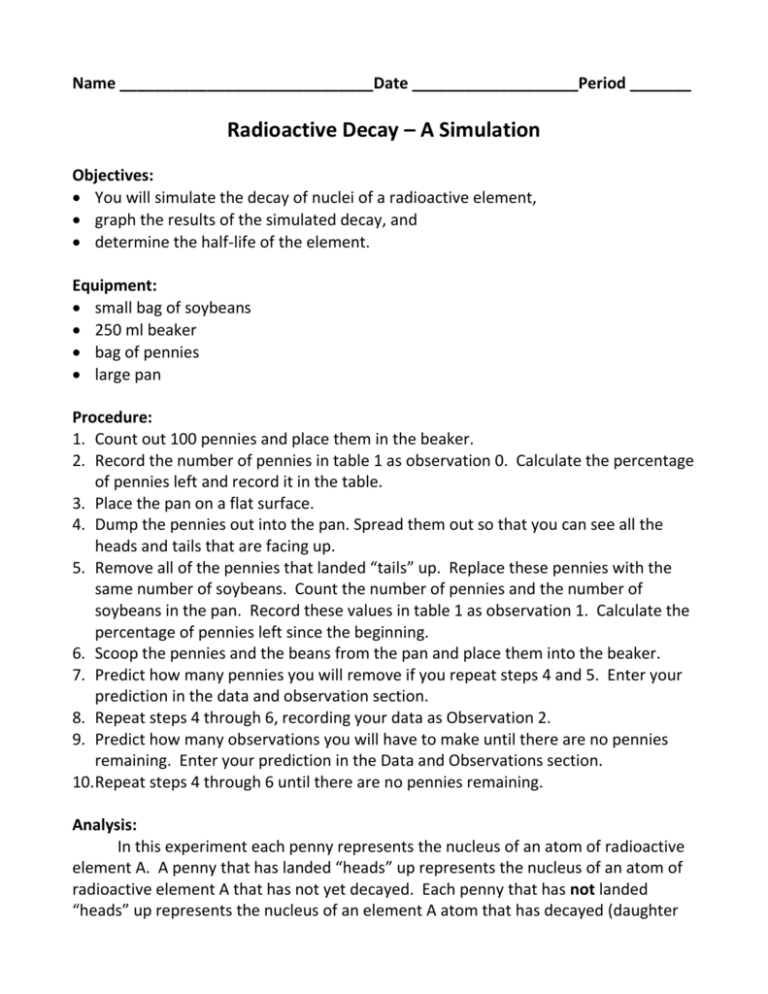
Name _____________________________Date ___________________Period _______ Radioactive Decay – A Simulation Objectives: You will simulate the decay of nuclei of a radioactive element, graph the results of the simulated decay, and determine the half-life of the element. Equipment: small bag of soybeans 250 ml beaker bag of pennies large pan Procedure: 1. Count out 100 pennies and place them in the beaker. 2. Record the number of pennies in table 1 as observation 0. Calculate the percentage of pennies left and record it in the table. 3. Place the pan on a flat surface. 4. Dump the pennies out into the pan. Spread them out so that you can see all the heads and tails that are facing up. 5. Remove all of the pennies that landed “tails” up. Replace these pennies with the same number of soybeans. Count the number of pennies and the number of soybeans in the pan. Record these values in table 1 as observation 1. Calculate the percentage of pennies left since the beginning. 6. Scoop the pennies and the beans from the pan and place them into the beaker. 7. Predict how many pennies you will remove if you repeat steps 4 and 5. Enter your prediction in the data and observation section. 8. Repeat steps 4 through 6, recording your data as Observation 2. 9. Predict how many observations you will have to make until there are no pennies remaining. Enter your prediction in the Data and Observations section. 10.Repeat steps 4 through 6 until there are no pennies remaining. Analysis: In this experiment each penny represents the nucleus of an atom of radioactive element A. A penny that has landed “heads” up represents the nucleus of an atom of radioactive element A that has not yet decayed. Each penny that has not landed “heads” up represents the nucleus of an element A atom that has decayed (daughter element). Each soybean represents the nucleus of an element B atom. That was formed by the decay of the nucleus of an element A atom. Assume that the time period between each observation was 5 minutes. Observation 1 will have been made at 5 minutes, observation 2 at 10 minutes, and so on. Complete the Time column in table 1. 1. Make a graph in the Data and Observations section to graph the results of your experiment. Plot on the Y axis the number of nuclei of element A atoms remaining after each observation. Plot the time of the observation on the X axis. 2. On the same graph construct another line. Plot on the graph the number of nuclei of element B atoms remaining after each observation. 3. Determine the approximate half-life of element A from your graph. Conclusions: 1. What is the approximate half-life of element A? 2. Use your graph to determine the number of nuclei of element A atoms remaining after 2 half-lives. After 3 half-lives. 3. Why did you replace pennies but not soybeans during the experiment? 4. The two graphs that you constructed look like mirror images. Explain why this is so. 5. Suppose you were given 400 pennies to do this experiment. Explain which of the following questions you could answer before starting the experiment. a. Can you identify which pennies will land “tails” up? b. Can you predict when an individual penny will land “tails” up? c. Can you predict how many pennies will be remaining after 3 observations? Data and Observations: Step 7. Predict the number of pennies removed: Step 9. Prediction of the number of observations until there are no pennies remaining: Table 1 Observation 0 1 2 3 4 5 6 7 8 9 10 11 12 13 Time (Min) Prediction Pennies Soybeans % of Pennies Left
