Universitetet i Oslo
advertisement
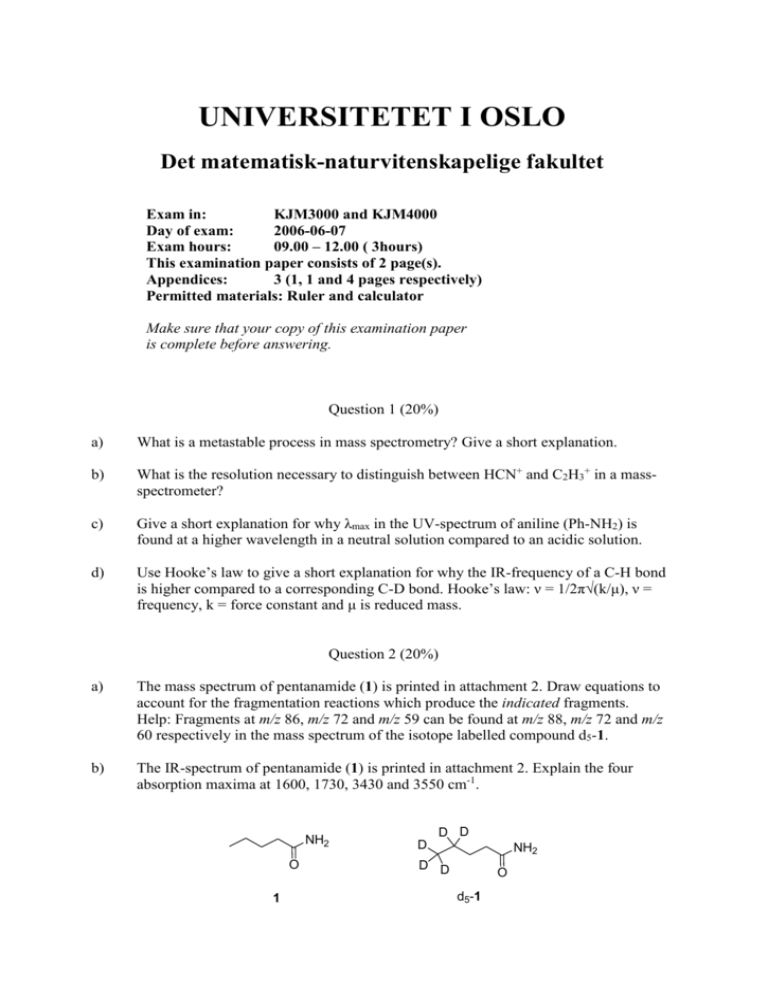
UNIVERSITETET I OSLO Det matematisk-naturvitenskapelige fakultet Exam in: KJM3000 and KJM4000 Day of exam: 2006-06-07 Exam hours: 09.00 – 12.00 ( 3hours) This examination paper consists of 2 page(s). Appendices: 3 (1, 1 and 4 pages respectively) Permitted materials: Ruler and calculator Make sure that your copy of this examination paper is complete before answering. Question 1 (20%) a) What is a metastable process in mass spectrometry? Give a short explanation. b) What is the resolution necessary to distinguish between HCN+ and C2H3+ in a massspectrometer? c) Give a short explanation for why λmax in the UV-spectrum of aniline (Ph-NH2) is found at a higher wavelength in a neutral solution compared to an acidic solution. d) Use Hooke’s law to give a short explanation for why the IR-frequency of a C-H bond is higher compared to a corresponding C-D bond. Hooke’s law: ν = 1/2π√(k/μ), ν = frequency, k = force constant and μ is reduced mass. Question 2 (20%) a) The mass spectrum of pentanamide (1) is printed in attachment 2. Draw equations to account for the fragmentation reactions which produce the indicated fragments. Help: Fragments at m/z 86, m/z 72 and m/z 59 can be found at m/z 88, m/z 72 and m/z 60 respectively in the mass spectrum of the isotope labelled compound d5-1. b) The IR-spectrum of pentanamide (1) is printed in attachment 2. Explain the four absorption maxima at 1600, 1730, 3430 and 3550 cm-1. NH2 O 1 D D D NH2 D D O d5-1 Question 3 (20%) OH O O N H 2 Compound 2 has been synthesised. Below are given a few selected NMR-data. (300 MHz; CDCl3): δ 1.45 (t, 3H, J=7.1 Hz), 4.45 (q, 2H, J=7.1 Hz), 5.01 (s, 2H), 6.34 (d, 1H, J=7.3 Hz), 6.85 (d, 1H, J=8.2 Hz), 6.97 (s, 1H), 7.29-7.35 (m, 1H), 10.75 (s, 1H) 1H-NMR Make an assignment of the signals in 1H-NMR-spectrum to structure 2 and briefly explain the coupling patterns. Question 4 (40%). An “unknown” compound has been studied spectroscopically. Propose a molecular structure for the “unknown” compound based on the spectroscopic data found in attachment 3. The mass spectrum shows a very weak signal at m/z 168. Assign as many of the signals in the 13Cand 1H-NMR spectra as possible and give a brief explanation for your assignments. Vedlegg 1 / Attachment 1 Vedlegg 2 / Attachment 2 MS-spekter (EI) av pentanamid (1) MS-spectrum (EI) of pentanamide (1) IR-spekter av pentanamid (1) IR-spectrum of pentanamide (1) Vedlegg 3 / Attachment 3 MS: UV-spectrum (in ethanol): λmax = 208 nm, log ε = 3.9 1H-NMR 1H-NMR spekter spectrum: Ekspandert del av 1H-NMR-spekter Extended regions of 1H-NMR-spectrum. 13C-NMR13C-NMR- og DEPT spektra. CH3 og CH opp, CH2 ned. and DEPT spectra. CH3 and CH up, CH2 down.
