Air Pollutant
advertisement
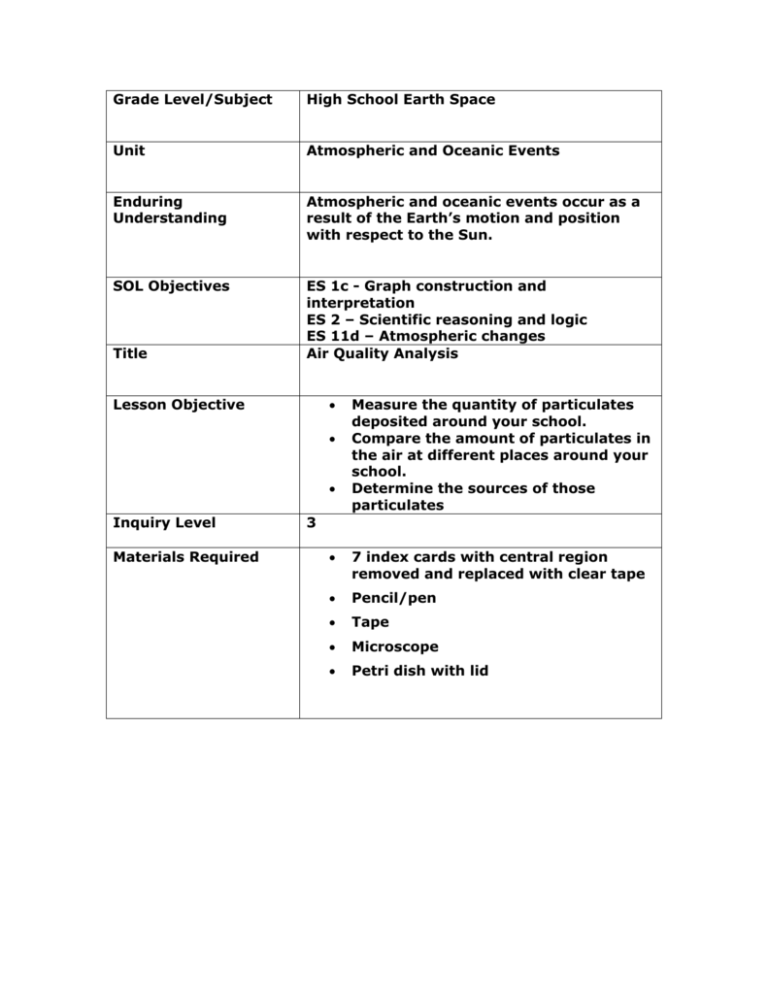
Grade Level/Subject High School Earth Space Unit Atmospheric and Oceanic Events Enduring Understanding Atmospheric and oceanic events occur as a result of the Earth’s motion and position with respect to the Sun. SOL Objectives ES 1c - Graph construction and interpretation ES 2 – Scientific reasoning and logic ES 11d – Atmospheric changes Air Quality Analysis Title Lesson Objective Inquiry Level Materials Required Measure the quantity of particulates deposited around your school. Compare the amount of particulates in the air at different places around your school. Determine the sources of those particulates 3 7 index cards with central region removed and replaced with clear tape Pencil/pen Tape Microscope Petri dish with lid Air Quality Analysis Activity 1 The Environmental Protection Agency (EPA) has established national air quality standards for six air pollutants shown in the chart below. Study the chart. Think about what can be done to lessen the effects of each pollutant. Common Air Pollutants Air Pollutant Carbon monoxide (CO) Major Source Automobile exhaust Nitrogen dioxide (NO2) Burning fossil fuels in power plants and automobiles Sulfur dioxide (SO2) Burning of fossil fuels in power plants, oil refineries, paper mills, volcanoes Factories, power plants, oil refineries, paper mills, volcanoes Smelters, battery plants Particle matter (dust, smoke, soot, ash) Lead (Pb) Ozone (O3) Reaction of nitrogen oxides and hydrocarbons in the presence of sunlight Effects Reduces delivery of oxygen to body tissues; impairs vision and reflexes Irritates lungs and lowers resistance to respiratory infections; and contributes to acid rain and smog Irritates respiratory system; contributes to acid rain Contributes to respiratory problems; linked to some cancers Damages nervous and digestive systems Reduces lung function and causes inflammation Questions: 1. Which pollutants affect the respiratory system? 2. How many pollutants can be caused by human activities? 3. What suggestions do you have for decreasing these pollutants? Activity 2 Background: Particulates are tiny solid and liquid particles suspended in the air. Breathing too many particulates can result in allergies, increased susceptibility to illness, and even lung damage. Some particulates come from natural sources such as pollen and wind-blow debris. Other particulates, however, result from human activity. Industry, transportation, and solid waste incinerators, for example, produce particulate-laden smoke. Your mission is to determine the air quality of your school environment and identify areas of greater particulate density. You will collect air quality data over an extended period of time. Using index cards with a central section replaced with tape, select 6 regions around the school, both indoors and outdoors, to collect particulate samples. You will have a seventh card placed inside a closed petri dish. Create a set of procedures that will outline your experiment and address how you will measure your data and for how long your experiment will last. Identify how you will record your data as well as how you will present your findings. Materials: 7 index cards with central region removed and replaced with clear tape Pencil/pen Tape Microscope Petri dish with lid Identify: Independent Variable ________________________________________________________________________ Dependent Variable ________________________________________________________________________ Control ________________________________________________________________________ Hypothesis: Create a hypothesis that address where you believe you will collect the most particulates from your experiment and provide a reason for your logic. ________________________________________________________________________ ________________________________________________________________________ ________________________________________________________________________ Describe your rationale behind the locations your group selected: Procedures: Write out your steps for creating this experiment. Include how you collect and record your data. Have your steps approved by the teacher before you gather your materials. 1. 2. 3. 4. 5. 6. 7. 8. Analysis: 1. After collecting your data, create a bar graph that shows the relationship between your IV and DV. 2. Compare the number of particulates deposited in each area. Where did you find the most particulates? Where did you find the least? How did the numbers compare to your predictions? 3. Based on your descriptions of the particulates, did the type of particulates differ from place to place? Were there significant differences in the particulate levels indoors and outdoors? Explain. 4. Identify some indoor and outdoor sources of particulates. 5. The severity of outdoor air pollution often depends on weather conditions. Explain how weather conditions might affect the particulate levels from day to day. 6. What are some ways people can improve air quality?
