Geospatial Applicationsin Air Pollution Modeling - Hrdp
advertisement
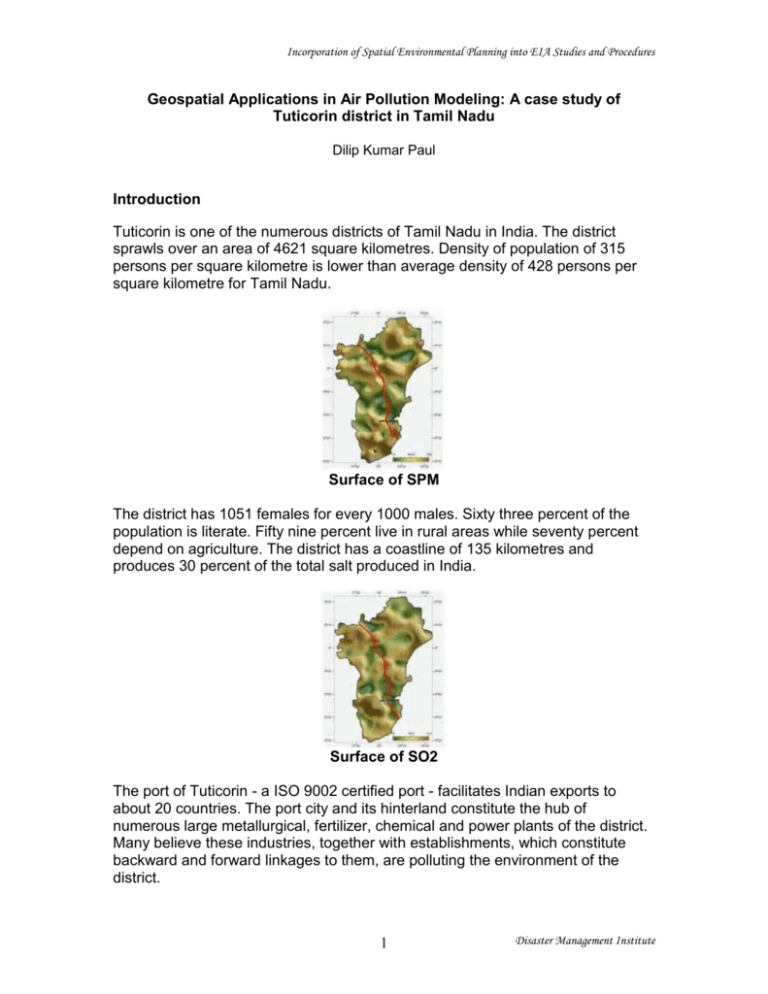
Incorporation of Spatial Environmental Planning into EIA Studies and Procedures Geospatial Applications in Air Pollution Modeling: A case study of Tuticorin district in Tamil Nadu Dilip Kumar Paul Introduction Tuticorin is one of the numerous districts of Tamil Nadu in India. The district sprawls over an area of 4621 square kilometres. Density of population of 315 persons per square kilometre is lower than average density of 428 persons per square kilometre for Tamil Nadu. Surface of SPM The district has 1051 females for every 1000 males. Sixty three percent of the population is literate. Fifty nine percent live in rural areas while seventy percent depend on agriculture. The district has a coastline of 135 kilometres and produces 30 percent of the total salt produced in India. Surface of SO2 The port of Tuticorin - a ISO 9002 certified port - facilitates Indian exports to about 20 countries. The port city and its hinterland constitute the hub of numerous large metallurgical, fertilizer, chemical and power plants of the district. Many believe these industries, together with establishments, which constitute backward and forward linkages to them, are polluting the environment of the district. 1 Disaster Management Institute Incorporation of Spatial Environmental Planning into EIA Studies and Procedures Surface of NOx The air quality data collected from 108 stations together with associated information on them constituted the major inputs. Some stations were located in the vicinity of major market places, bus stands and industries. Most of the stations were located within the premises of residential buildings, school buildings, and the buildings of government departments. The sampling points were located 3 to 5 metres above the ground. Pollution via SPM, SO2, NOx The Study Inputs for the study include a scanned map, a database on air quality data collected from 108 stations and a 4-band multispectral image. Spatial data editor is used to create a vector of district boundary from georeferenced-scanned map. The vector is then used for creating a region of district boundary. Database is imported as a vector of 108 data collection stations. Database on air quality data on SPM, SO2, and NOx is used for generating surfaces depicting spatial spread of pollution in the district. 2 Disaster Management Institute Incorporation of Spatial Environmental Planning into EIA Studies and Procedures Hexagon grid Class / training raster Raster extraction process via district boundary region is used for creating the extracts of surfaces of pollutants. Relief Shading, contrast enhancement, pseudo coloring, processes are applied on surfaces for comprehension of qualitative and quantitative spread of pollution. Threshold contour lines are extracted from surfaces. Extracts of contour lines are exclusively combined to distinguish more polluted areas from less polluted ones. Resultant output indicates that 68 percent of the district is reasonably polluted. Profile views along the road from Kovilpatti to Thiruchendur are created for three surfaces. Air quality standards For developing models for monitoring / keeping SPM within sustainable limits, a multispectral image is imported, georeferenced and classified via a supervised classification process, wherein ground truth information is used for creating the training set. The resultant class raster is edited to incorporate tag values representing levels of pollution manifested by the class raster of land cover. A surface raster of sustainability is created with data articulated within limits of air quality standards. 3 Disaster Management Institute Incorporation of Spatial Environmental Planning into EIA Studies and Procedures SPM pollution via model The properties of hexagon grid cells - created via polygon grid process - are extracted from surface raster of sustainable SPM pollution (created via surface modeling process), prevailing air quality raster (created via supervised classification of multispectral image) and actual SPM pollution surface raster. A table with a computed field (with implied one-to-one attachment with polygon ID) for air quality records of hexagon cells is created. A theme map of records of computed field displays the spatial spread of air quality achieved via management formula for keeping the air quality standards. Following table indicates the changes statistically. Comments Geospatial applications for modeling air pollution include the following steps: importing, georeferencing, spatial data editing, surface modeling, relief shading, pseudo color editing, creating and using region, extracting and merging vectors, supervised classification, polygon grid sampling, extracting grid cell properties, and theme mapping. The inputs for study came from Professor N.C. Chandrasekar and Mr. T. Jayasekar of VOCC, Tuticorin and Professor Victor Rajamanickam, of Tamil University, Thanjavur. The study - for reasons of paucity of funds - is not exhaustive. Yet it vindicates the potential benefits of geospatial modeling of air pollution in rural, urban, and regional planning for activities of dwelling, working and amenities. **** 4 Disaster Management Institute

