Toy Car Lab File
advertisement
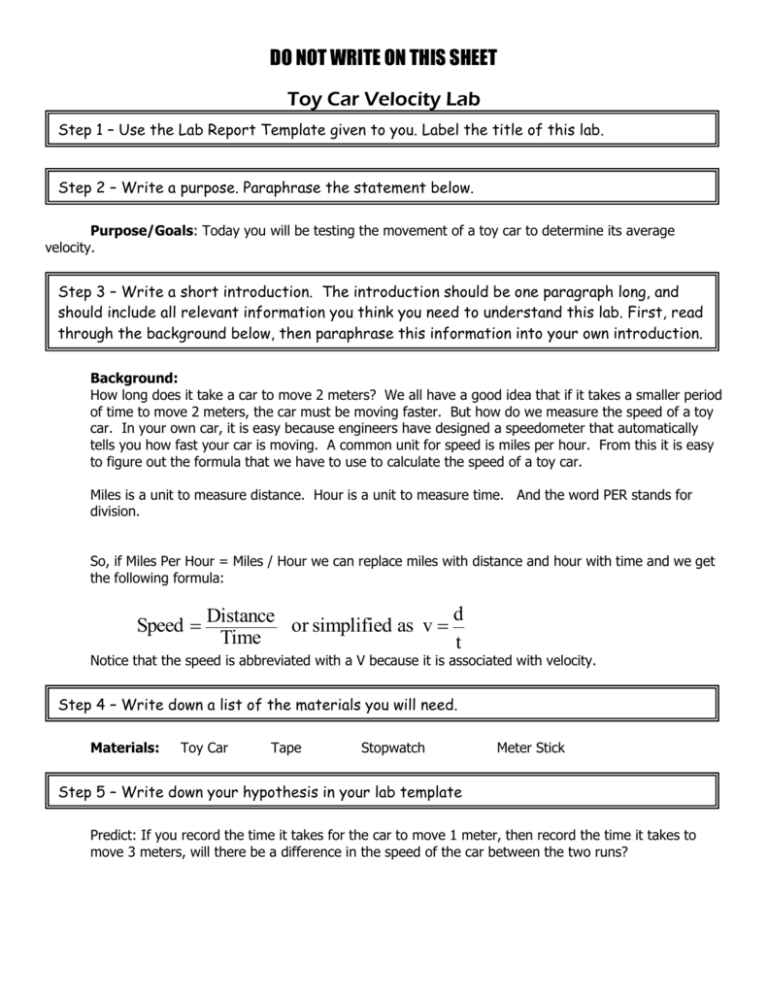
DO NOT WRITE ON THIS SHEET Toy Car Velocity Lab Step 1 – Use the Lab Report Template given to you. Label the title of this lab. Step 2 – Write a purpose. Paraphrase the statement below. Purpose/Goals: Today you will be testing the movement of a toy car to determine its average velocity. Step 3 – Write a short introduction. The introduction should be one paragraph long, and should include all relevant information you think you need to understand this lab. First, read through the background below, then paraphrase this information into your own introduction. Background: How long does it take a car to move 2 meters? We all have a good idea that if it takes a smaller period of time to move 2 meters, the car must be moving faster. But how do we measure the speed of a toy car. In your own car, it is easy because engineers have designed a speedometer that automatically tells you how fast your car is moving. A common unit for speed is miles per hour. From this it is easy to figure out the formula that we have to use to calculate the speed of a toy car. Miles is a unit to measure distance. Hour is a unit to measure time. And the word PER stands for division. So, if Miles Per Hour = Miles / Hour we can replace miles with distance and hour with time and we get the following formula: d Speed Distance or simplified as v Time t Notice that the speed is abbreviated with a V because it is associated with velocity. Step 4 – Write down a list of the materials you will need. Materials: Toy Car Tape Stopwatch Meter Stick Step 5 – Write down your hypothesis in your lab template Predict: If you record the time it takes for the car to move 1 meter, then record the time it takes to move 3 meters, will there be a difference in the speed of the car between the two runs? DO NOT WRITE ON THIS SHEET Step 6 – Copy this procedure onto your lab template. Procedures: 1. Using piece of tape, mark off the following locations on the floor or a tape: 0 meters, 1 meter, 2 meters, 3 meters. 2. Place the car on the floor about 0.5 meters in front of the tape that is marked at 0 meters. Start the car and allow it to move toward the 0 meter mark. 3. When the front of the car reaches the 0 meter mark, start your stopwatch. Then, stop the stopwatch when the front of the car reaches the 1 meter mark. Record the time in the table below. 4. Repeat this procedure for 2 more trials. 5. Calculate the average time and record in the table. 6. Calculate the average speed using the formula given in the background and record in the table. 7. Repeat the steps above, but this time allow the car to move from the 0 meter mark to the 2 meter mark. Do this for three trials. Then, do the same thing and allow the car to move from the 0 meter mark to the 3 meter mark and do this for three trials. Step 7 – Collect your data and record it in a data table. Copy this table directly into your lab template. Data Collection for Toy Car Velocity Distance traveled (m) 1 2 3 Time Trial 1 Time Trial 2 Time Trial 3 Average Time Average Speed (s) (s) (s) (s) (m/s) DO NOT WRITE ON THIS SHEET Step 8 – Analyze your data by answering some post-lab questions. Write the answers to these in TAG directly in your analysis section. Data Analysis 1. Was there a significant difference in the speed of the car while it traveled 1 meter versus 3 meters? Explain why. 2. What happens to the time of travel of the car if the distance that the car moves increases? 3. The difference between speed and velocity is that speed is a number, or magnitude, while velocity also indicates the direction of motion. Velocity also uses displacement rather than distance for the calculation. (All that matters for velocity is the difference between the starting and ending points and the direction between those two points.) What would happen to the calculation for velocity if you made car go in a big circle and finish at the same place that it started? 4. What is the reason for rerunning the experiment with multiple trials? Why not let the car run one time and record the time? Step 9 – Write a conclusion in your lab template. Conclusions should be written in paragraph form with complete sentences. Every time you write a conclusion, do the HEPLA! 1) Repeat the original purpose and Hypothesis. 2) Evaluate your hypothesis using the data you collected. Was your hypothesis supported or rejected by the data? 3) Make a Prediction based on your data. Imagine you are doing the experiment another time, but this time you measure the time it takes for the car to reach a 4 meter line. How long do you think it would take? Hint: if you know what the velocity of your car is, and you know the distance it will travel, can you find the time it will take? 4) Include at least 2-3 potential sources of error or Limitations of your data. OR include at least 2-3 improvements you would make to the experiment. a. Why are the times for each trial slightly different? (Why do we do 3 trials for each meter mark?) b. What would happen to your results if you switched the person who did the timing? c. What would happen to your results if you switched to a different toy car when you were halfway done with the lab? 5) Includes a potential Application for what you learned. a. How can you apply what you did today in lab to the real world?

