1. Introduction - Online Abstract Submission and Invitation System
advertisement
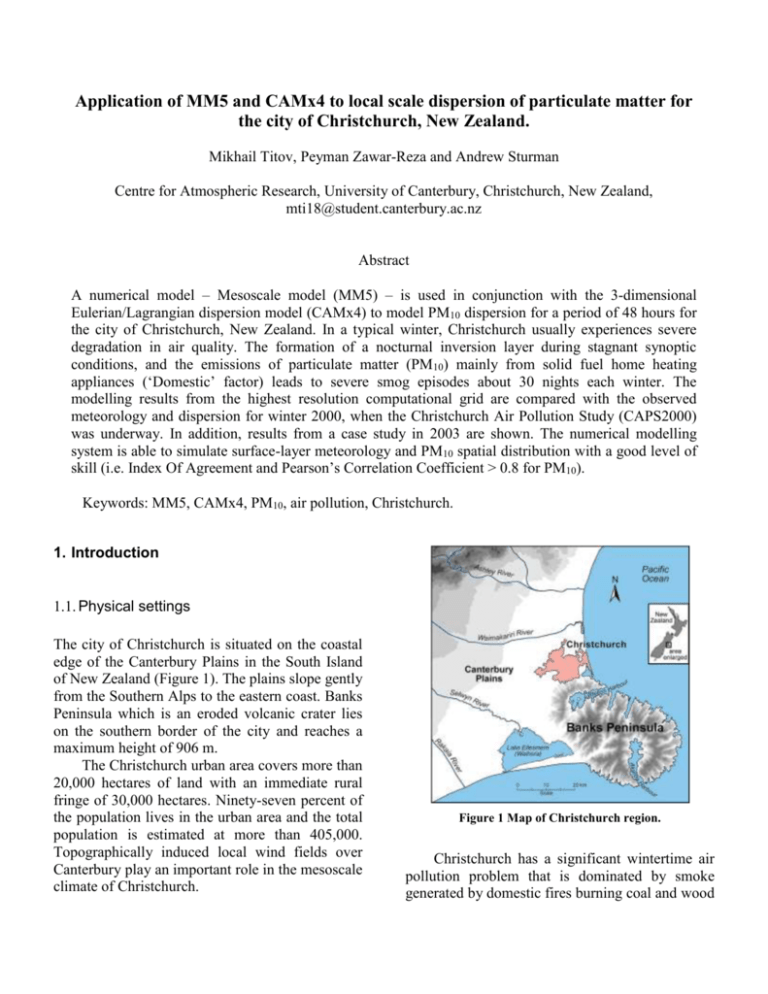
Application of MM5 and CAMx4 to local scale dispersion of particulate matter for the city of Christchurch, New Zealand. Mikhail Titov, Peyman Zawar-Reza and Andrew Sturman Centre for Atmospheric Research, University of Canterbury, Christchurch, New Zealand, mti18@student.canterbury.ac.nz Abstract A numerical model – Mesoscale model (MM5) – is used in conjunction with the 3-dimensional Eulerian/Lagrangian dispersion model (CAMx4) to model PM10 dispersion for a period of 48 hours for the city of Christchurch, New Zealand. In a typical winter, Christchurch usually experiences severe degradation in air quality. The formation of a nocturnal inversion layer during stagnant synoptic conditions, and the emissions of particulate matter (PM10) mainly from solid fuel home heating appliances (‘Domestic’ factor) leads to severe smog episodes about 30 nights each winter. The modelling results from the highest resolution computational grid are compared with the observed meteorology and dispersion for winter 2000, when the Christchurch Air Pollution Study (CAPS2000) was underway. In addition, results from a case study in 2003 are shown. The numerical modelling system is able to simulate surface-layer meteorology and PM10 spatial distribution with a good level of skill (i.e. Index Of Agreement and Pearson’s Correlation Coefficient > 0.8 for PM10). Keywords: MM5, CAMx4, PM10, air pollution, Christchurch. 1. Introduction 1.1. Physical settings The city of Christchurch is situated on the coastal edge of the Canterbury Plains in the South Island of New Zealand (Figure 1). The plains slope gently from the Southern Alps to the eastern coast. Banks Peninsula which is an eroded volcanic crater lies on the southern border of the city and reaches a maximum height of 906 m. The Christchurch urban area covers more than 20,000 hectares of land with an immediate rural fringe of 30,000 hectares. Ninety-seven percent of the population lives in the urban area and the total population is estimated at more than 405,000. Topographically induced local wind fields over Canterbury play an important role in the mesoscale climate of Christchurch. Figure 1 Map of Christchurch region. Christchurch has a significant wintertime air pollution problem that is dominated by smoke generated by domestic fires burning coal and wood on cold nights (Spronken-Smith et al., 2001). The emissions consist mostly of particulate matter (PM10). After sunset, under anti-cyclonic weather conditions, a strong surface temperature inversion due to long-wave cooling increases the pollution potential, resulting in high air pollution concentrations. The winter season can be characterized by the frequent occurrence of severe nocturnal smog events, where health guideline exceeded about 30 nights each winter (Sturman et al., 2002; Aberkane, 2000). 1.2. Local meteorology and air pollution episodes Previous research into the role of synoptic climatology in pollution episodes has shown that situations with post-frontal southwesterly winds, or with northwesterly winds aloft (but undeveloped at the surface), or with weak easterly synoptic-scale flows are favorable for the development of severe smog events (Owens and Tapper, 1977). The near-surface airflow during smog nights is often dominated by westerly cold air drainage from the Southern Alps, which can enhance the strength of near-surface temperature inversion (Johnston, 2000; Kossmann and Sturman, 2004) and generate zones of stagnant air resulting from convergence with drainage winds down the slopes of Banks Peninsula (Figure 2). The dataset used as a metric for the modelling exercise was obtained during The Christchurch Air Pollution Study 2000 (CAPS2000; Kossmann and Sturman, 2004). During CAPS2000, a relatively dense network of automatic weather stations and air pollution measurement stations were setup to more clearly characterize the spatial and temporal heterogeneity of meteorology and pollution dispersion during smog nights. Figure 2 A conceptual model of airflow during smog episodes. 2. Description of MM5-CAMx4 2.1. Background MM5 is a non-hydrostatic limited-area mesoscale model with terrain-following sigma-coordinate system to simulate (predict) mesoscale atmospheric circulations. It was developed by the National Centre for Atmospheric Research (NCAR) (Grell et al., 1994). The Comprehensive Air quality Model (CAMx4) is an Eulerian photochemical dispersion model that is designed to unify all of the technical features required of ‘state-of-the-science’ air quality models into a single efficient system. CAMx4 simulates the emission, chemical reactions and removal of pollutants by solving the pollutant continuity equation for each chemical species (ENVIRON, 2003). The combined MM5-CAMx4 numerical system provides advantages in predicting pollution dispersion over complex terrain, since the mesoscale model calculates surface layer meteorological fields (i.e. vertical profiles of temperature, and turbulence intensities) and then these parameters are used as input to drive CAMx4 to estimate the dispersion of air pollutants. 2.2. Modelling design for MM5 MM5 simulations shown here used four grids with spatial resolutions of 27 km, 9 km, 3 km and 1 km (Figure 3). The coarsest resolution grid covers nearly all of New Zealand and the 4th grid covers Christchurch with suburbs (Figure 1 shows the rough geographical extent of grid 4). The centre of all 4 grids was located at the University of Canterbury in Christchurch (43.318S, 172.345W). Topography and land-use distribution was obtained from the United States Geological Survey (USGS) global database (the difference between real orography and the interpolated one for grid 4 was less than a 25% reduction of mean height in modelled topography). Figure 3 Grid setup Global analysis data were used for initialization and nudging of MM5 meteorological fields during each run. To reduce the influence of global analysis on mesoscale features, several methods were used to initialize grid 4, these are: Grid 4 was spawned on the simulation 12 hours into the simulation; First 3 grids were run separately and grid 3 output data were used to evaluate grid 4 (oneway nesting); On the first stage only grid 1 was run with input global analysis data, on the second stage grids 2 and 3 were initialized by grid 1 output, and on the third stage grid 4 was run with input data from grid 3. It was found that the last procedure produced the best results. 2.3. Modelling design for CAMx4 Gridded emissions data for PM10 have a resolution of 1 km and were prepared using GIS (for details see Zawar-Reza et al., 2005). All experiments use the ‘Total’ emission group option, which is dominated by processes of solid fuel combustion from the ‘Domestic’, ‘Vehicle’ and ‘Industry’ groups (the main contributors to the aerosol air pollution: 85–95 %). To account for the diurnal variation in PM10 emissions, the Christchurch “mean winter day” emission inventory (Supplied by Environment Canterbury) comes in four time intervals. Each file represents a constant in time emissions for the following periods: 10pm – 6am; 6am – 10am; 10am – 4 pm; 4pm – 10 pm. A 5point time filter was subsequently applied to all initial concentration fields to smooth the difference of concentration values between different time periods. Next step in assimilation of emission fields involved splitting of PM10 on the species for CAMx4. Four main species that made up nearly 100% of PM contain were chosen (Ryan, 2002) with the Split Mass Factor (SMF) for each specie defined for high pollution nights dominated by wooden smoke: Pollutant Elemental Carbon (PEC) with SMF = 0.51; Pollutant Organic Carbon (POA) with SMF = 0.48; Pollutant SO4 (PSO4) with SMF = 0.0089 and Pollutant NO3 (PNO3) with SMF = 0.0011. To calculate PM10 dispersion, a 2-level option for vertical layers was chosen (as a comparison, results from 6-level runs are also shown). The top level in the 2-level mode reaches a height of 40–45 m which typically corresponds to the height of the nocturnal inversion layer where more than 90% of the pollution is trapped (Sturman et al., 2003, pers. comm.). All simulations with CAMx4 had spatial resolution of 1 km (coinciding with grid 4 of MM5). To minimize the loss of modeled meteorological information during interpolation of MM5 fields into CAMx4 grid, CAMx4 is run with the same vertical levels as MM5. To properly simulate PM10 dispersion, CAMx4 usually needs a period of ‘spin-up’ time. It was found that generally, the runs that started at mid-day gave better results (comparison not shown here). 0.7 for IOA. Values above 0.6 are generally accepted to represent skill by the model. Therefore, at least for these two days, MM5 performed very well. 3. Modelling results 3.1. Mesoscale meteorology Surface radiation balance and partitioning of energy into component fluxes are important driver of low level airflow. As illustrated in Figure 4, MM5 calculates the net radiation balance very well. The partitioning of net radiation into sensible and latent heat fluxes is also very good (results not shown here). It is beyond the scope of this paper to describe the parameterization schemes used with MM5. Figure 5 Measured and observed wind speed and direction. Table 1 IOA, PCC, S-RMSE, U-RMSE, August 2000. Figure 4 Modelled and measured net radiation flux density. As shown in Figure 5, MM5 captures the diurnal shift between the daytime north-easterly wind and the nocturnal westerly very well. Index of agreement (IOA), Pearson correlation coefficient (PCC), systematic and unsystematic root mean square errors (S-RMSE, U-RMSE) as recommended by Wilmott et al., 1985 are represented in Table 1 as a measure of the model’s performance. MM5 consistently scores higher than EXPERMENT PCC S-RMSE U-RMSE IOA Wind Speed 0.71 0.35 0.81 0.81 U-component 0.85 0.52 1.16 0.91 V-component 0.71 0.63 1.06 0.71 Temperature 0.92 1.14 1.31 0.80 Relative Humidity 0.87 3.88 5.81 0.90 3.2. CAMx4 dispersion results Time series of observed, and modeled (for both 2level and 6-level CAMx4 runs) are shown in Figure 6 for one of the measuring stations. a coefficient 2.0 was used to multiply input emission files to receive more realistic modelled results. PCC for modeled and observed PM10 concentrations ranged between 0.90 (6-level model) and 0.92 (2-level model), and IOA was about 0.89 and 0.91. 4. Concluding remarks Figure 6 Modelled and measured PM 10 concentration at Polytechnic. CAMx4 is able to calculate the diurnal variation in ground-level PM10 very well. The discrepancy in the results is probably due to the rather coarse temporal resolution of the emission inventory. PCC for modelled and observed PM10 concentrations ranged between 0.85 (6-level model) and 0.89 (2-level model), and IOA was close to 0.91. Figure 7 Modelled and measured PM 10 concentrations at Aranui. Figure 7 shows additional results from simulations performed for 2003. For this three day period CAMx4 also performs well. Winter 2003 was colder than winter 2000, with nearly twice higher PM10 peaks during severe smog nights and This research was undertaken to asses the utility of MM5-CAMx4 modelling system in predicting PM10 concentrations during stagnant synoptic conditions over the complex topography of Christchurch. At least for the case studies shown here, MM5 is able to reproduce mesoscale meteorology to a satisfactory degree, in addition, CAMx4 captures the diurnal variation and the peak concentrations very well. References Aberkane T., 2000, Annual air quality monitoring report 1999, Environment Canterbury, Report No. 00/78, 32pp. ENVIRON International Corporation, 2003, Comprehensive Air quality Model with extensions (CAMx), version 4.00, Novato, California. Grell, G.A., Dudhia, J. and Stauffer D., 1994, A description of the Fifth-Generation Penn State/NCAR Mesoscale Model (MM5). NCAR Tech Note NCAR/TN-398+STR, 138 pp. Johnstone S.J., 2000, The interaction of inversion development and katabatic winds: Implications for air pollution in Christchurch, MSc thesis, Department of Geography, University of Canterbury. Kossmann M. and Sturman A., 2004, The surface wind field during winter smog nights in Christchurch and coastal Canterbury, New Zealand, International Journal of Climatology vol. 24,pp. 93-108. Owens, I.F., Tapper, N.J., 1977, The influence of meteorological factors on air pollution occurrences in Christchurch, In Proceedings of the air and environment conference, Rotorua, New Zealand, pp. 403–20. Ryan, R., 2002, Specification profiles and assignment files located on EMCH, Memorandum, EPA, U.S.A. Spronken-Smith, R.A., Sturman, A.P., Wilton, E., 2001, The air pollution problem in Christchurch, New Zealand, Progress and Prospects, Clean Air and Environmental Quality, vol. 36, pp. 23–8. Sturman, A.P., 2000, Impact of meteorology on air pollution in Canterbury, Invited paper to the air pollution and health Conference, Christchurch, 3 – 6 August, 2000. Sturman, A.P., Kossmann, M., Spronken-Smith, R.A. and Zawar-Reza, P., 2001, The Christchurch Air Pollution Study (CAPS) 2000 – An overview and preliminary results, Proceedings of the Third Urban Air Quality Symposium: Measurement, Modelling and Management, Loutraki, pp. 68–72. Sturman, A.P., Kossmann, M., Zawar-Reza, P., Spronken-Smith, R.A. and Boorer, S., 2002, Air pollution meteorology of Timaru, South Canterbury, New Zealand. 16th International Clean Air and Environment Conference of the Clean Air Society of Australia and New Zealand, Christchurch, New Zealand 18–22 August, 2002, pp. 764–770. Sturman, A.P., Kossmann, M., Zawar-Reza, P., Vergeiner, J., 2003, Vertical structure of the atmospheric boundary layer during high air pollution events in Christchurch, New Zealand, National Clean Air Conference: Linking Air Pollution Science, Policy and Management, Newcastle, Australia, November 23-27, 2003. Wilmott, C.J., Ackleston, S.G., Davis, R.E., Feddema, J.J., Klink, K.M., Legates, D.R., O’Donnell, J., Rowe, C.M., 1985, Statistics for the evaluation and comparison of models, Journal of Geophysical Research, vol. 90 (C5), pp. 8995– 9005.


![You can the presentation here [Powerpoint, 1.01MB]](http://s2.studylib.net/store/data/005417570_1-0810139cfc2485ebcaf952e0ae8bb49a-300x300.png)

