How to do a line graph by hand
advertisement
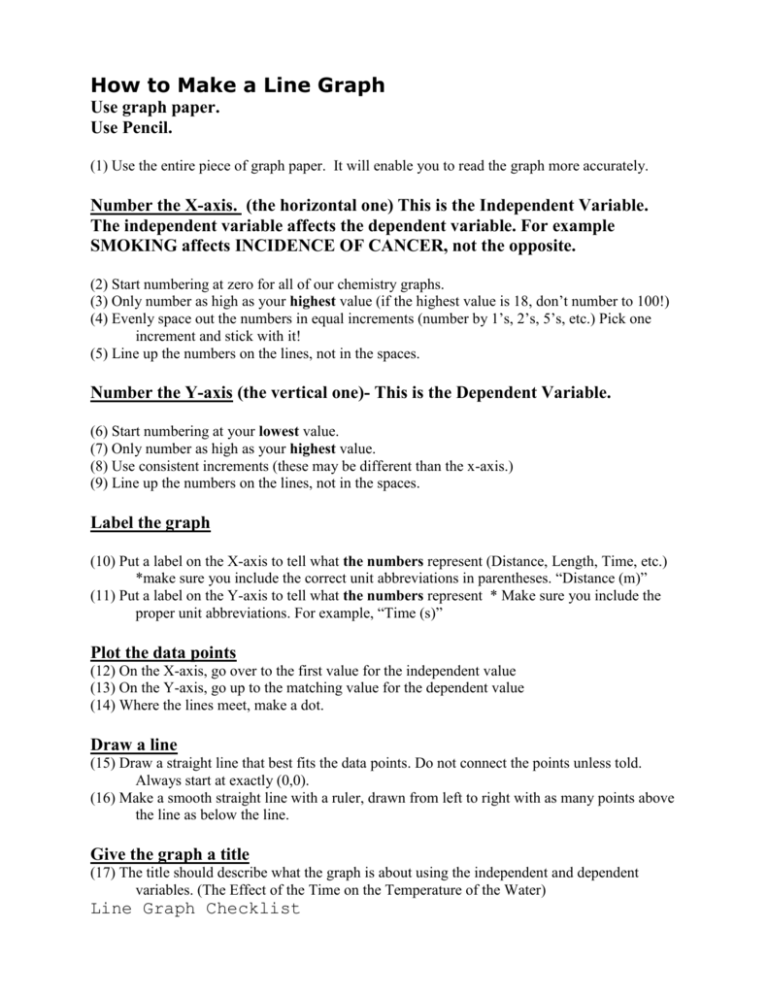
How to Make a Line Graph Use graph paper. Use Pencil. (1) Use the entire piece of graph paper. It will enable you to read the graph more accurately. Number the X-axis. (the horizontal one) This is the Independent Variable. The independent variable affects the dependent variable. For example SMOKING affects INCIDENCE OF CANCER, not the opposite. (2) Start numbering at zero for all of our chemistry graphs. (3) Only number as high as your highest value (if the highest value is 18, don’t number to 100!) (4) Evenly space out the numbers in equal increments (number by 1’s, 2’s, 5’s, etc.) Pick one increment and stick with it! (5) Line up the numbers on the lines, not in the spaces. Number the Y-axis (the vertical one)- This is the Dependent Variable. (6) Start numbering at your lowest value. (7) Only number as high as your highest value. (8) Use consistent increments (these may be different than the x-axis.) (9) Line up the numbers on the lines, not in the spaces. Label the graph (10) Put a label on the X-axis to tell what the numbers represent (Distance, Length, Time, etc.) *make sure you include the correct unit abbreviations in parentheses. “Distance (m)” (11) Put a label on the Y-axis to tell what the numbers represent * Make sure you include the proper unit abbreviations. For example, “Time (s)” Plot the data points (12) On the X-axis, go over to the first value for the independent value (13) On the Y-axis, go up to the matching value for the dependent value (14) Where the lines meet, make a dot. Draw a line (15) Draw a straight line that best fits the data points. Do not connect the points unless told. Always start at exactly (0,0). (16) Make a smooth straight line with a ruler, drawn from left to right with as many points above the line as below the line. Give the graph a title (17) The title should describe what the graph is about using the independent and dependent variables. (The Effect of the Time on the Temperature of the Water) Line Graph Checklist Does/Is my graph: � neatly done on graph paper? Used a ruler. Used full sheet of paper Marked the numbers on the lines, not in the spaces � numbered correctly on the x-axis? The numbers should go from the lowest value to the highest value The numbers should be evenly spaced increments (all by 2’s or all by 5’s, 10’s, etc.). � have a correct label on the x-axis? The label should tell what the numbers represent. � have the correct unit of measurement on the x-axis? The unit of measurement should be written in parentheses next to the label. � numbered correctly on the y-axis? The numbers should go from the lowest value to the highest value starting at zero. The numbers should be evenly spaced increments � have a correct label on the y-axis? The label should tell what the numbers represent. � have the correct unit of measurement on the y-axis? The unit of measurement (feet, seconds, years, etc.) should be written in parentheses next to the label. � have a correctly written title? The title should be written in the format of “The Effect of (the IV) on (the DV).” � have a correctly drawn line? The line should be the “best fit” line. The line should never zig-zag from right to left. It should not connect dot-to dot (unless otherwise told later in the year).

