Sample modelling or problem-solving task – Geese
advertisement
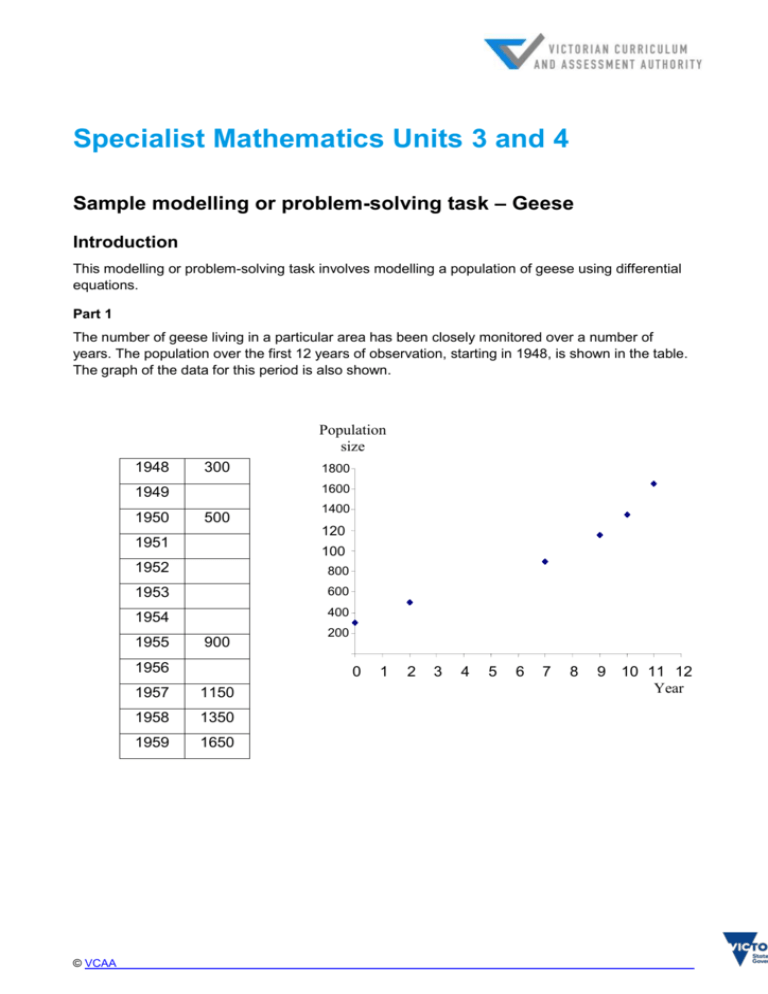
Specialist Mathematics Units 3 and 4 Sample modelling or problem-solving task – Geese Introduction This modelling or problem-solving task involves modelling a population of geese using differential equations. Part 1 The number of geese living in a particular area has been closely monitored over a number of years. The population over the first 12 years of observation, starting in 1948, is shown in the table. The graph of the data for this period is also shown. Population size 1948 300 1600 1949 1950 500 1400 1951 120 0 100 1952 0800 1953 600 1954 400 1955 900 1956 © VCAA 1800 200 0 1957 1150 1958 1350 1959 1650 1 2 3 4 5 6 7 8 9 10 11 12 Year Sample modelling or problem-solving task – Geese Assume that or these years assume that the birthrate and deathrate of the population is proportional to population size and there are no other influencing factors. a. Set up a differential equation to model this situation, and find the general solution of the differential equation to give the population size P, t years after 1948. Find a particular solution which models the data. b. Use this to give the number of geese in 1956, a year when the census was not taken. The actual population of geese in 1974 was 5200. What does the model predict for this year? c. Use exponential regression fucntionality of technology to obtain constants Po and b such that the population P at time t years after 1948 is given by P = Poebt. These values are determined by a statistical technique. Compare the two models. Part 2 The population growth patterns changed over the next decade. The extended graph is as shown below. Population size 4500 4000 3500 3000 2500 2000 1500 1000 500 Year 0 1 2 3 4 5 6 7 8 9 10 11 12 13 14 15 16 17 18 19 20 21 22 23 24 25 The initial model does not work for this extended set of data. A commonly used form of differential equation to model this type of population growth is: dP kP(Pe - P) , where k and Pe are constants and t is the time in years after 1959. dt = Pe a. Solve this differential equation assuming that when t = 0, P = 2069 and Pe = 3545, A k = 0.833. Write the solution in the form 1 + Ce-kt © VCAA Page 2 Sample modelling or problem-solving task – Geese dP b. Find dt in terms of t. dP dP c. Sketch the graphs of P against t, dt against P, and dt against t. dP d. For what population is the rate of change, dt , a maximum? In which year is the rate a maximum? Use this model to predict the population in 1985. Part 3 a. Form a hybrid function using the results from Part 1 and Part 2 that describes the growth of the population from 1948 to 1971. Plot the graph of this hybrid function. b. By 1994 the population had grown considerably. The authorities allowed geese to be shot at a rate of S geese per year. A differential equation to describe this is: dP kP(Pe – P) – S, where Pe and k are constants. dt = Pe c. If the population is to become stable a restriction on the number of geese shot per year is necessary. Find the maximum number of geese which can be shot per year in terms of Pe and dP k. (Hint: Consider dt = 0 and use the discriminant related to the resulting quadratic equation.) d. For Pe= 16000 and k = 0.1, find the maximum number of geese which can be shot to enable a stable population to be reached. Find the size of the stable population corresponding to this value of S. dP kP(Pe – P) e. Solve the differential equation dt = – S with Pe= 16000 and k = 0.1, Pe and P = 13000 when t = 0 (1994) and S =300. Areas of study The following content from the areas of study is addressed through this task. Area of study Content dot point Functions and graphs - Algebra - Calculus 1, 2, 3, 4, 5, 6, 7, 8, 9,10,11 Vectors - Mechanics - Probability and statistics - © VCAA Page 3 Sample modelling or problem-solving task – Geese Outcomes The following outcomes, key knowledge and key skills are addressed through this task. Outcome Key knowledge dot point Key skill dot point 1 13,14 14 2 5 3,4,5 3 1, 2, 3, 4, 5, 6 1, 2, 3, 4, 5, 6, 7, 9, 10, 11 © VCAA Page 4
