Revised Supplementary Material (A13.11.0285R
advertisement
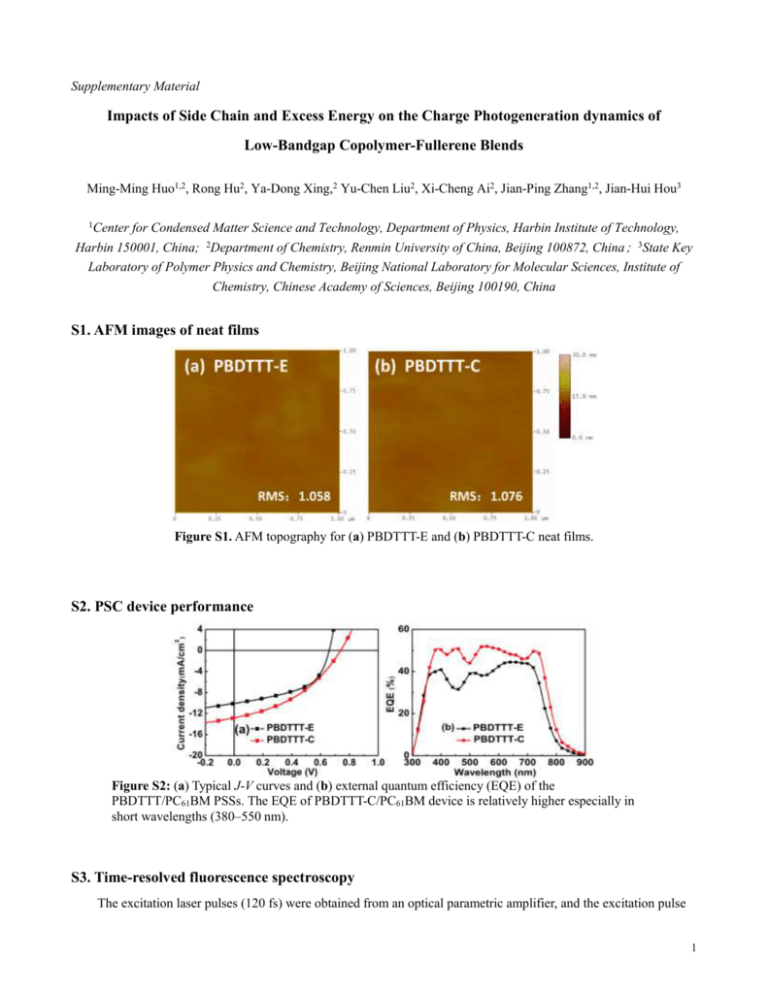
Supplementary Material Impacts of Side Chain and Excess Energy on the Charge Photogeneration dynamics of Low-Bandgap Copolymer-Fullerene Blends Ming-Ming Huo1,2, Rong Hu2, Ya-Dong Xing,2 Yu-Chen Liu2, Xi-Cheng Ai2, Jian-Ping Zhang1,2, Jian-Hui Hou3 1 Center for Condensed Matter Science and Technology, Department of Physics, Harbin Institute of Technology, Harbin 150001, China; 2Department of Chemistry, Renmin University of China, Beijing 100872, China; 3State Key Laboratory of Polymer Physics and Chemistry, Beijing National Laboratory for Molecular Sciences, Institute of Chemistry, Chinese Academy of Sciences, Beijing 100190, China S1. AFM images of neat films Figure S1. AFM topography for (a) PBDTTT-E and (b) PBDTTT-C neat films. S2. PSC device performance Figure S2: (a) Typical J-V curves and (b) external quantum efficiency (EQE) of the PBDTTT/PC61BM PSSs. The EQE of PBDTTT-C/PC61BM device is relatively higher especially in short wavelengths (380–550 nm). S3. Time-resolved fluorescence spectroscopy The excitation laser pulses (120 fs) were obtained from an optical parametric amplifier, and the excitation pulse 1 energy was attenuated to 100 nJ/pulse. Fluorescence was detected with a photon-counting type streak camera (C5680, Hamamatsu Photonics) with a spectral resolution of 0.2 nm and a temporal resolution of a few tens of picoseconds depending on the delay time range. The experiments were performed at ambient temperature (296 K). Figure S3. Comparison of the TA kinetics at 1300 nm (black) and the fluorescence at 850 nm kinetics (red) for the neat PBDTTT films. The TA kinetics were plotted from the TA data matrices collected under photoexcitation at 700 nm (cf. Figure 4 of the main text). The fluorescence kinetics are scaled to the corresponding TA kinetics. Solid lines are fitting curves derived by fitting the fluorescence kinetics data to bi-exponential model functions. The decay time constants of PBDTTT-E were 3.70.6 ps (46%) and 12017 ps (54%), giving rise to an apparent fluorescence lifetime of <F>=11717 ps. The decay time constants of PBDTTT-C were 6.51.4 ps (45%) and 798 ps (55%), giving rise to an apparent fluorescence lifetime of <F>=741.4 ps. The apparent fluorescence lifetime <F> was determined by using the relationS1 n n 2 F ai i a j j (n = 1, 2), where i and ai, respectively, represent the individual decay time constant i 1 j and the corresponding pre-exponential factor. S4. Spectral decomposition of steady-state fluorescence spectra Figure S4. Fluorescence spectra of (a, b) PBDTTT:PCBM blend films and (c, d) PBDTTT neat films. In each panel, the red curve was obtained as the result of Gaussian fitting using the two sub-Gaussian components shown in green. S5. Kinetics parameters derived from curve fitting TABLE S1. Decay Time Constants () Derived from Global Fitting of the Kinetics at Three Probing Wavelengths (pr) to a Tri-exponential Model function for Neat PBDTTT Films under Different Excitation Wavelengths (ex). Cf. Figure 5 of the main text. Deconvolution to Instrumental Response Function Was Made in Curve Fitting. 2 ex Decay time constants 2 (ps) -E 810/1100/1300 3.40.8 6715 -C 810/1100/1300 0.340.33a) 8.01.8 14929 490 -E 810/1100/1300 2.90.6 11032 -C 810/1100/1300 5.41.1 12748 a) Four exponential decay function was used for global fitting in this case. (nm) 700 PBDTTT pr (nm) 0 (ps) 1 (ps) 3 (ns) >2 >2 >2 >2 TABLE S2. Decay Time Constants () Derived from Multi-exponential Curve Fitting of the Kinetics at Different Probing Wavelengths (pr) for PBDTTT-E:PCBM and PBDTTT-C:PCBM Blend Films under Different Excitation Wavelengths (ex). Cf. Figure 7 of the main text. Deconvolution to Instrumental Response Function Was Made in Curve Fitting. ex (nm) PBDTTT: PCBM -E 700 -C -E 490 -C pr (nm) 820 1100 1300 820 1100 1300 820 1100 1300 820 1100 1300 1 (ps) 0.100.07 0.070.04 0.100.03 Fitting parameters 3 (ps) 2.50.8 (rise) 34.110.6 20.812.2 3.91.3 (rise) 4.50.6 1238 9.14.4 4.51.4 (rise) 12357 (rise) 13329 1.80.2 (rise) 17.49.1 (rise) 32.28.4 32.34.9 (rise) 2 (ps) 0.030.01 4 (ps) Long Long Long Long (rise) Long Long Long Long Long Long Long (rise) Long (rise) S6. Excitation photon fluence dependence of OD amplitude and TA kinetics Figure S6-1. Plot of OD amplitude at t=0.16 ps and pr=1300 nm against excitation photon fluence (Ph) for neat PBDTTT films at different excitation wavelengths (ex). Dashed straight lines are for guiding the eyes. 3 Figure S6-2. Normalized TA kinetics at pr=1100 nm for the neat PBDTTT films photoexcited at ex under the indicated excitation photon fluence (in photonscm2pulse1). Insets show the kinetics details up to 5 ps. S7. Microsecond near-infrared TA spectroscopy The excitation pulses (683 nm, 7 ns) were obtained from a hydrogen-charged Raman shifter pumped with the second harmonics from a Nd:YAG laser (Quanta-Ray Pro-Series, Spectra Physics Lasers Inc., Mountain View, CA). A continuous xenon lamp provided the visible and near-infrared probe light. The temporal evolution of OD in visible (400-900 nm) and near-infrared region(900 nm-1300 nm) were recorded using Si PIN photodiode (model S3071, Hamamaysu Photonics, Hamamatsu, Japan) and a high-gain InGaAs pin-photodiode (G8370-82, Hamamatsu Photonics, Hamamatsu, Japan), respectively. The signal from the photodiode was pre-amplified and sent to a digital storage oscilloscope (bandwidth 600 MHz; LeCroy WaveSurfer 64Xs, Chestnut Ridge, NY). Kinetics traces were averaged upon photoexcitation of 500 laser shots, yielding an OD detection sensitivity better than 104. Appropriate optical filters were used to reduce the scatting and the stray light. The anaerobic condition was achieved by vacuuming the film samples in a thermostat (323 K) for 2 hours, and then cooled the samples back to room temperature (296 K). Spectroscopic measurements were performed for the samples in vacuum at room temperature. Figure S7. (a, b) Comparison of the near-infrared TA spectra t=1 s to those recorded at t=2.13 ns by femtosecond TA spectroscopy. The spectra in each panel are normalized. (c, d) Comparison of the microsecond kinetics traces at pr=1100 nm recorded under aerobic condition to those under and anaerobic condition. In panels (a) or (b), the discrepancy to the shorter 4 wavelength side is due to the relaxation of the ICT (interfacial charge transfer) components. S8. Kinetics for PBDTTT-C:PC61BM under high excitation fluence Figure S8. TA kinetics at the indicated probing wavelengths for the PBDTTT-C:PC61BM blend photoexcited at (a) at ex=700 nm and (b) ex=490 nm under high photon fluence (2.81014 photonscm−2pulse−1). Solid lines are fitting curves derived from least-square curve fitting based on multi-exponential model functions. S9. Kinetics anisotropy Figure S9. TA anisotropy kinetics of P+ probed at pr=1100 nm for PBDTTT-E:PC61BM and PBDTTT-C:PC61BM blends photoexcited at ex=700 nm and ex=490 nm (2.81013 photonscm−2pulse−1). REFERENCES S1. M. T. Neves-Petersen, Z. Gryczynski, J. Lakowicz, P. Fojan, S. Pedersen, E. Petersen, and S. Bjørn Petersen, Protein Sci. 11, 588 (2009). 5
