Tidal Theory: Lunar & Solar Tides Explained
advertisement
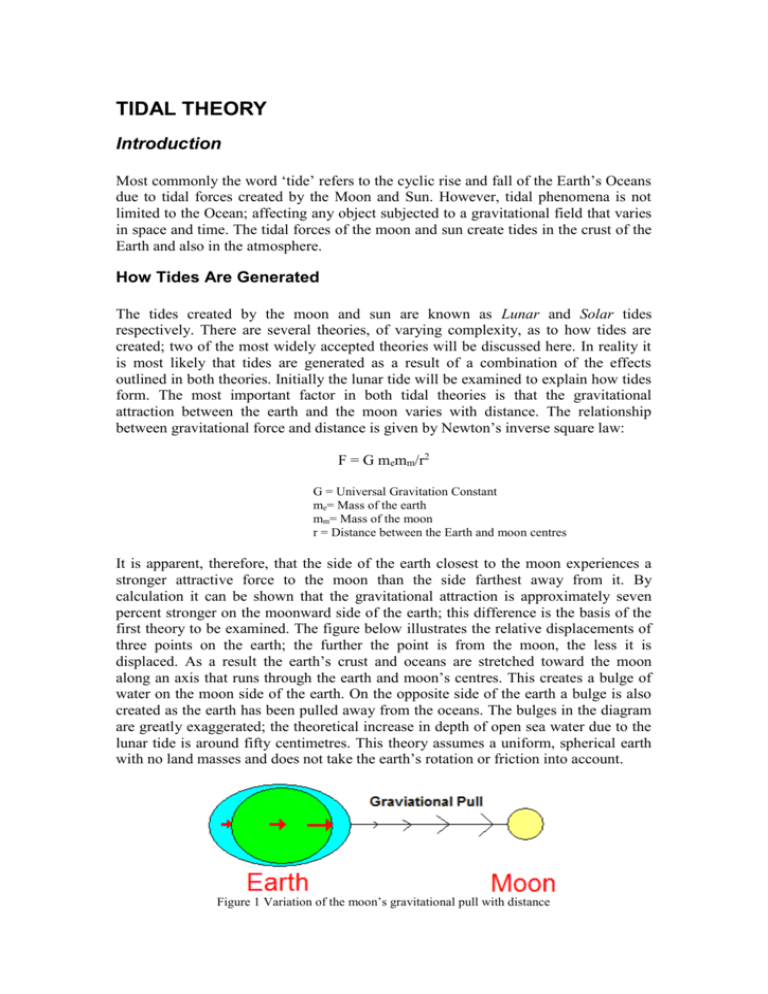
TIDAL THEORY Introduction Most commonly the word ‘tide’ refers to the cyclic rise and fall of the Earth’s Oceans due to tidal forces created by the Moon and Sun. However, tidal phenomena is not limited to the Ocean; affecting any object subjected to a gravitational field that varies in space and time. The tidal forces of the moon and sun create tides in the crust of the Earth and also in the atmosphere. How Tides Are Generated The tides created by the moon and sun are known as Lunar and Solar tides respectively. There are several theories, of varying complexity, as to how tides are created; two of the most widely accepted theories will be discussed here. In reality it is most likely that tides are generated as a result of a combination of the effects outlined in both theories. Initially the lunar tide will be examined to explain how tides form. The most important factor in both tidal theories is that the gravitational attraction between the earth and the moon varies with distance. The relationship between gravitational force and distance is given by Newton’s inverse square law: F = G memm/r2 G = Universal Gravitation Constant me= Mass of the earth mm= Mass of the moon r = Distance between the Earth and moon centres It is apparent, therefore, that the side of the earth closest to the moon experiences a stronger attractive force to the moon than the side farthest away from it. By calculation it can be shown that the gravitational attraction is approximately seven percent stronger on the moonward side of the earth; this difference is the basis of the first theory to be examined. The figure below illustrates the relative displacements of three points on the earth; the further the point is from the moon, the less it is displaced. As a result the earth’s crust and oceans are stretched toward the moon along an axis that runs through the earth and moon’s centres. This creates a bulge of water on the moon side of the earth. On the opposite side of the earth a bulge is also created as the earth has been pulled away from the oceans. The bulges in the diagram are greatly exaggerated; the theoretical increase in depth of open sea water due to the lunar tide is around fifty centimetres. This theory assumes a uniform, spherical earth with no land masses and does not take the earth’s rotation or friction into account. Figure 1 Variation of the moon’s gravitational pull with distance The second theory is known as the equilibrium theory and is based on the rotation of the earth-moon system. A common misconception is that the moon simply orbits around the centre of the earth. Due to the earth’s much greater mass, when compared to the moon, the orbital centre of mass, or barycentre, of the earth-moon system is located at approximately three-quarters of the distance from the centre of the earth to its surface. As a result the centrifugal force applied to the oceans, due to the earth’s rotation about the barycentre, varies with position. The side of the earth opposite the moon feels the strongest centrifugal force, creating a tidal bulge in the oceans on this side. The gravitational pull of the moon on the earth causes the oceans to swell on the opposite side of the earth, that closest to the moon. When the centrifugal forces exerted by the earth and gravitational forces from the moon are combined it results in two swells in the oceans, of approximately equal amplitude, directly opposite each other. Figure 2 Representation of the equilibrium theory It must now be remembered that the Earth rotates about its own axis, its surface moving beneath the oceans. As a result, coasts generally experience two high tides a day coinciding with when they line up with each of the two bulges of water. High tide occurs in intervals of twelve hours and twenty-five minutes, this is due to the rotation of the moon relative to the earth. It takes the earth twelve hours to rotate 180°; in this time the moon has advanced by 6°, which is why there is an extra, ‘unexpected’, twenty-five minutes between high tides. The solar tide works using the same principles, but its magnitude is less than half that of the lunar tide. The solar and lunar tides interact to give noticeable variation in the overall tides of the oceans. These facts are detailed the sections that follow. Tidal Forces Tidal forces are differential forces; they are the result of the difference in gravitational force between two points. As a result it is useful to introduce the potential function, V, to help analyse the tidal forces of the sun and moon: F total V total , where V total V m oon V sun The relationship between the tidal potentials, and therefore the tidal forces produced by the sun and moon is given by an inverse cube relation: V sun m r sun moon V moon mmoon rsun 3 Body Moon Sun m (kg) (Mass) 7.36 x 10²² 1.99 x 1030 r (m) (Mean distance to Earth) 3.84 x 10⁸ 1.5 x 10¹¹ Substituting the values from the table into the relation yields a ratio of 0.454; i.e. solar tidal forces are less than half the magnitude of the lunar tidal forces. This correlates with observations of the oceans tides; their variation very much synchronised with the movement of the moon. Tidal Force Components Tidal forces have both vertical and horizontal components; it the latter that is the major contributor to the earth’s tides, and is known as the tractive force. The tractive force is at a maximum when the force lines are parallel to the surface of the earth; shown by the red arrows in the following figure. The tractive force is zero at the point directly below the moon, and directly opposite that point (points A and B respectively). These points represent the positions where the vertical tidal force component is a maximum. 1As a result objects directly below the moon decrease in weight by a factor of approximately 1/107. The Queen Mary 2 ocean liner, for example, would be 14.6kg lighter than normal when at point A. A B Figure 3 Tractive forces exerted on the Earth by the Moon Tidal Predictions on a Global Scale The production of tides lends itself to being predicted due to its apparently periodic nature. Tides are constantly generated by the sun and moon, but the magnitude of the tide varies due to interactions between the cycles of the earth, moon and sun. As a result a variety of tidal cycles, with different periods, are created. Because the astronomical behaviour of the earth-moon-sun system is well understood, it is possible to predict tidal behaviour, on a global scale, well into the future. Spring / Neap Tides Spring tides are created when the Sun and Moon are both in line with the Earth, i.e. during full or new moon, resulting in Lunar and Solar tides collaborating. This results in high tide being higher than normal, and low tide being lower than normal. Neap tides occur when the Sun is at 90° to the Moon; this causes the lunar high tide to occur at the same point as the solar low tide, and Lunar low tide to coincide with the solar high tide. The results are lower high tides, and higher low tides. Neap tides occur at the first and third quarters of the Moon’s cycle. The spring tidal range is approximately twice that of the neap tide. Figure 4 Orientation of the sun and moon during spring and neap tides Lunar Variations The distance between the moon and earth varies due to the moons elliptic, 27.3 day orbit. The moon is said to be at perigee at its closest point to earth, 363,104km, and apogee at its farthest, 405,696km. The amplitude of the tide varies as a result of the changes in separation between the two bodies. The effect is greatest when perigee coincides with a spring tide, giving the largest spring tide, or when apogee coincides with a neap tide, giving the smallest neap tide. Equinoctial Tides Close to the Spring Equinox of March 21st, and the Vernal equinox of September 23rd spring tides are higher than normal due to the alignment of the moon’s orbit to that of the earth. Similarly, smaller spring tides than average are experienced close to the summer and winter solstices. The Age of the Tide When making tidal predictions it is important to note that there is a delay between the astronomical cycle and the resulting tidal cycle. This phenomenon is known as the age of the tide, and the length of the delay varies with the positioning and characteristics of each coast. In the North Sea, for example, the delay between a new or full moon and the spring tide is approximately two days. Predictions of Local Tides Up to this stage, tides have been considered on a global scale, looking at the theoretical behaviour of the oceans as a whole. For engineers, it is localised tides that are of the greatest use in the identification of the best areas to harness tidal power. In order to predict tides at a particular coastal point, the sea level must be observed and recorded for a prolonged period using a tide gauge. Tide gauges are mechanical or electronic devices used to measure sea level at designated time intervals. The data from a tide gauge is Figure 5 Tidal staff used to measure extreme high tides at the Severn Estuary used to plot a continuous curve of sea height against time, as shown in the figures below. Categorisation of Tides Due to the inclination of the lunar and solar orbits relative to the earth, two distinct types of tide are experienced on coastlines depending on their location. Semi-diurnal tides behave according to the theoretical tidal model discussed earlier, producing two high and low tides each day. Diurnal tides produce only one high tide and low tide per day. A variation of the semi-diurnal tide is the mixed tide; in this case there are two high tides a day, but of different amplitudes. The map below displays which type of tide is experienced by each coastal location. Figure 6 The semi-diurnal, diurnal and mixed tidal cycles (from top to bottom) Figure 7 Summary of the tides experienced by the Earth’s coasts Tidal Range The open sea tidal range, the difference between high and low tide sea levels, averages approximately one metre. The tidal range experienced by certain coastal areas, however, greatly exceeds this figure; the world’s largest tidal range occurs at the Bay of Fundy, Canada; recorded at over sixteen metres. The second largest tidal range is that of the Severn Estuary and Bristol Channel; reaching up to fifteen metres. The average tidal range experienced by the earth’s coastlines is similar to the open sea range at around one metre. The key factor that affects the tidal range of a coastal point is its topography; the surface features, both natural and man made, of the sea bed and coastline. With the right topography, tidal resonance can occur; the process responsible for the huge tides of the Bay of Fundy and the Bristol Channel. Tidal resonance occurs when the movement of the tide excites one of the resonant modes of the ocean. It is of greatest effect when the ocean meets with a continental shelf whose width is approximately one quarter of the oceans wavelength. This situation leads to superposition of the incident tidal waves with those reflected between the shelf edge and the coast; creating much larger tidal ranges as a result. Estuaries often experience increased tidal range due to their funnel like shape, getting thinner as the sea comes inland whilst also getting shallower. The largest tidal range is usually observed in the vicinity of the Severn crossings. Figure 8 Schematic of a generalised coastline Surges and Weather Effects The movements of ocean water due to meteorological effects, such as changes in atmospheric pressure and winds, are known as surges. Accurate tidal prediction is made more difficult by surges because weather forecasting can only predict meteorological events for the very near future. Even with the most advanced computer software, accurate predictions can only be made about the next thirty-six hours of weather. The sea levels given in tide tables only take the astronomical cycles into consideration and not surges. For this reason there is usually a difference between the values stated in tide tables and those actually measured. Tidal surges act independently to the astronomical tides. If a surge is large enough, and coincides with the astronomical tides it can result in mass flooding. In November 2007 the east coast of England and the Netherlands were warned of a three-metre surge tide in the North Sea. The surge, created by storm winds, was expected to coincide with high tide and, therefore, flood defences were in danger of being breached. Fortunately, when the surge reached the coast it had reduced in size and did not cause any Figure 9 Coasts threatened by the surge major damage. The figure below shows how a surge tide can be created by a storm and brought inland. The low atmospheric pressure associated with a storm creates a bulge in the sea surface. Sea levels rise by approximately 1cm for every 1 millibar decrease in pressure; a depression of 960 millibar, which is 50 millibars below average barometric pressure, would raise sea levels by approximately half a metre. A tidal surge is created when the powerful winds of a storm push the bulge towards the coast. Figure 10 Production of a storm tidal surge Tidal Streams Tidal streams, or currents, are the horizontal motion of ocean waters due to the tide. Flood flow refers to tidal streams when high tide is impending, i.e. the tide is ‘coming in’. Ebb flow refers to tidal streams when low tide is impending, i.e. the tide is ‘going out’. Tidal streams have both direction and magnitude, which makes them more complex to analyse compared to tidal ranges, which are scalars. Collecting tidal stream data is more difficult than for tidal range as the strength and direction of currents can vary greatly over short distances, whereas tidal range is relatively constant over a wide area. Tidal streams vary with a location’s depth, and are also strongly influenced by the shape of the area from which they originated. Due to these facts, even the most simple of assumptions cannot be made about real life tidal streams. In a simplistic model, however, tidal streams will be in one direction during flood flow and in another direction during ebb flow. The two directions are not necessarily reciprocal. Velocities along the flood direction are taken to be positive and those along the ebb direction, negative. In many situations tidal streams are not totally dominated by the basic ebb and flow directions. In this case, an analysis should take both a primary flow direction and a secondary, orthogonal direction in to account. Figure 11 Example of a Tidal Stream Atlas The behaviour of tidal streams at a particular coastal location can be looked up using a tidal stream atlas, or chart, which generally consist of twelve diagrams; one for every hour of the tidal cycle. Each of the diagrams uses arrows and numbers to represent the direction and speed of streams at various points in the local waters. At certain points in the tidal cycle there may be no measurable tidal streams; these areas are known as slack water. Slack water usually occurs near the time of high or low tide, and also at instances in between when the current changes direction. The energy in tidal streams, and therefore the power available, is proportional to the cube of flow velocity. The cubic relationship between velocity and power means that a large change in the power density can be caused by a tiny variation in tidal stream velocity. As mentioned previously, spring tides have roughly twice the magnitude of neap tides. Due to the cube law there is approximately eight (i.e. 23) times more tidal stream power during spring tides than neaps. Figure 12 Variation of tidal power during spring/neap tides Analysing the Tidal Resource of the UK The UK is made up of islands and as such has a large quantity of coastline for its area. For this reason tidal power shows great promise for the UK in the future, as the country seeks sustainable energy. The maps of the UK below display the relative quantities of tidal power available around the coastlines, from both tidal streams and tidal range. The edge of the coloured border marks the UK’s continental shelf and Channel Island territorial sea limit. Figure 13 UK Tidal Stream Resource Figure 14 UK Tidal Range Resource

