The periodogram is defined as the squared spectral density of a time
advertisement
Protocol S1:
Most of the statistical procedures of this paper were implemented in R [s1]. For some
specific procedures, additional software is indicated below.
The periodogram and de-trending of the time series:
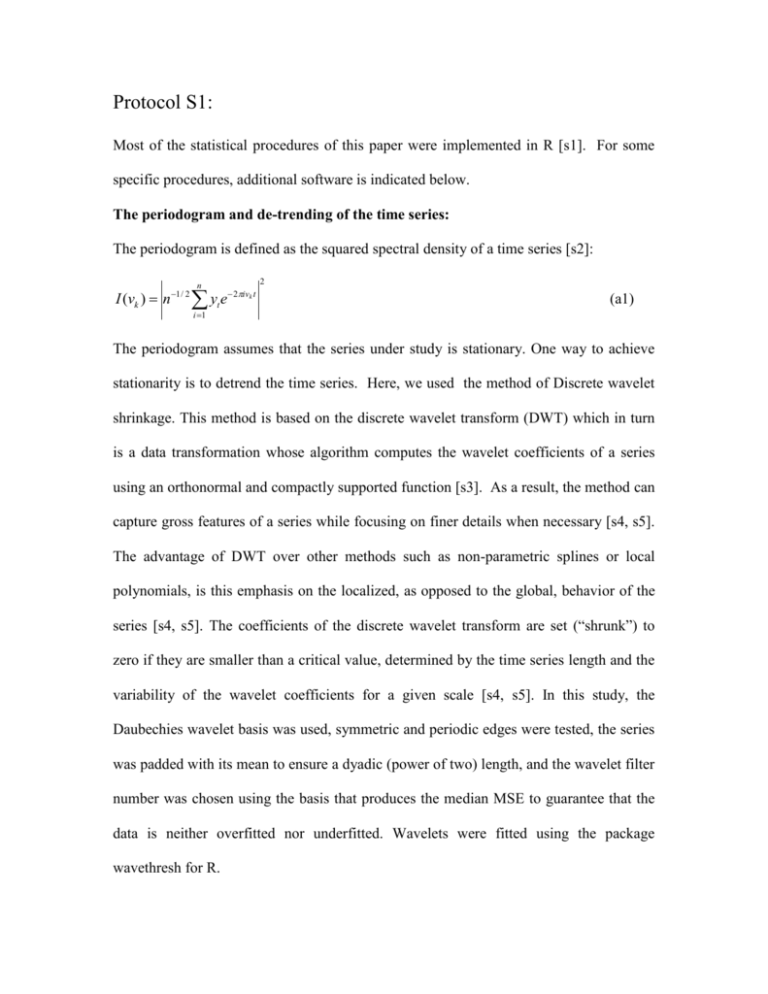
The periodogram is defined as the squared spectral density of a time series [s2]:
I (vk ) n
1 / 2
n
ye
i 1
t
2
2ivk t
(a1)
The periodogram assumes that the series under study is stationary. One way to achieve
stationarity is to detrend the time series. Here, we used the method of Discrete wavelet
shrinkage. This method is based on the discrete wavelet transform (DWT) which in turn
is a data transformation whose algorithm computes the wavelet coefficients of a series
using an orthonormal and compactly supported function [s3]. As a result, the method can
capture gross features of a series while focusing on finer details when necessary [s4, s5].
The advantage of DWT over other methods such as non-parametric splines or local
polynomials, is this emphasis on the localized, as opposed to the global, behavior of the
series [s4, s5]. The coefficients of the discrete wavelet transform are set (“shrunk”) to
zero if they are smaller than a critical value, determined by the time series length and the
variability of the wavelet coefficients for a given scale [s4, s5]. In this study, the
Daubechies wavelet basis was used, symmetric and periodic edges were tested, the series
was padded with its mean to ensure a dyadic (power of two) length, and the wavelet filter
number was chosen using the basis that produces the median MSE to guarantee that the
data is neither overfitted nor underfitted. Wavelets were fitted using the package
wavethresh for R.
Maximum entropy spectral density and non-Parametric de-noising of nonstationary time series
We obtained the dominant frequency of the cycles with a second method, maximum
entropy spectral density, to examine the robustness of our findings. The maximum
entropy spectral density Y(vk) is applied to identify cycles in time series whose nonstationarity can be approximated by an autoregressive process [s6]. It is computed as
follows:
p
Y (vk ) / 1 j e
2
w
2
2ijvk
(a2)
j 1
Again, peaks in this density indicate dominant frequencies. To successfully apply this
technique, it is necessary to first separate signal from noise in the data, which we
achieved with the two following methods:
1) Smoothing splines. The principle of this method is the minimization of a function that
accounts for the trade-off between the fit, measured through the MSE, and λ, the degree
of smoothness [s7]:
yt ( xt ) t
y
t
t
ˆ ( xt ) ' ' ( xt )
2
2
(a3)
where ρ are weights used for robustness to outliers. The parameter λ was selected using
generalized cross-validation [s7].
2) Singular spectrum analysis. This non-parametric technique separates trends and
oscillatory components from noise in a time series. The method consists in the
computation of the eigenvalues and eigenvectors from a covariance matrix {M} whose
element mij is the covariance between lags i and j. The projection of the time series on the
eigenvectors (the principal components of the matrix) reconstructs the pattern of
variability associated with the selected eigenvalue, resulting in a de-noised time series
[s6].
The eigenvalues themselves indicate how much variance is accounted for by the
different components. For the SSA the toolkit described in [s6] was used.
Wavelet Power Spectrum
The wavelet power spectrum (WPSy) is obtained from the so-called wavelet
transform (WTy(s)). The best way to understand this transform is to consider that it is the
product of the data and a function known as a wavelet (ψ) which is different from zero
only for a range of values centered around the origin. By systematically translating the
wavelet in time and computing this product, we obtain the transform
n
WT y ( s ) y j * ( j it ) / s
(a4)
j 1
as a function of temporal scale s [s8, s9]. By contrast, the periodogram relies on the
Fourier transform which uses sinusoidal functions that repeat continuously in time. This
difference underlies the localization in time of the wavelet power spectrum given by the
squared wavelet transform
WPS y WT y
2
(a5)
Wavelet Cross-Spectrum and patterns of association in non-stationary time series
Wavelet coherency is computed using the wavelet power spectrum of the two series
under study as
WCO yx
WT yWTx *
WPS WPS
1/ 2
y
x
(a6)
and varies between 0 and 1, with a value of 1 indicating maximum coherency.
The time lag separating the two time series under study can also be determined by
computing the phase of the cross wavelet spectrum, defined as the angle separating the
real and imaginary parts of the wavelet cross spectrum [s8, s9]:
yx tan
1
WT WT
WTyWTx
*
*
y
(a7)
x
Linear models and forecasts
One strategy for fitting time series models is to use their state space
representation, that is, to find the underlying (not observed) process that produces the
observed patterns in the time series [s2, s10].
State Space Representations
Time series can be seen as realizations of an unobserved stochastic process. Any
unobserved process {yt} that can be expressed using observation and state equations has a
state space representation [s2]. For the model process {yt} presented in (1) the state space
representation can be obtained by introducing the following state vector:
y t 13
y
t 12
xt
y t 1
y t
.
(a8)
The observation equation is:
yt 0 0 0 1xt
while the state equation is given by:
(a9)
xt 1
1
0 0
0 0
0
0
0 0
112 12
0
1
0
0
0 0
0
0
0
0
0
0
0
xt Tt 4 MEI t 13 t
0 1
0
0
0
a
1
1
0 1
(a10)
where the error is identically and normally distributed, i.e., t ~ N (0, w2 ) . For this
unobserved process to have the same characteristics than those of the observed time
series, it is necessary to address: (i) the correlation of the data over time (the smoothing
problem), (ii) the fitting of every observation (the filtering problem) and (iii) the
forecasting of future events (the prediction problem). These problems can be solved
using Kalman Recursions [s2, s10]. The exact likelihood is computed via a state-space
representation of the SAR process, and the innovations (i.e., residuals) and their variance
found by a Kalman filter [s10].
References
s1 R Development Core Team (2005). R: A language and environment for statistical
computing. R Foundation for Statistical Computing, Vienna, Austria. ISBN 3-900051-070, URL http://www.R-project.org.
s2 Brockwell PJ, Davis RA (2002) Introduction to Time Series and Forecasting. 2nd ed.
New York: Springer.
s3 Gençay R, Selçuk F, Whitcher B (2002) An introduction to wavelets and other
filtering methods in finance and economics. San Diego: Academic Press.
s4 Shumway RH, Stoffer DS (2000) Time series analysis and its applications. New York:
Springer. 572 p.
s5 Faraway JJ (2006) Extending the linear model with R: Generalized Linear, Mixed
Effects and Non-parametric regression models. Boca Raton: Chapman and Hall CRC
press.
s6 Ghil M, Allen RM, Dettinger DM, Ide K, Kondrashov D, Mann ME, Robertson A,
Saunders A, Tian Y, Varadi F, Yiou P. (2002) Advanced spectral methods for climatic
time series. Rev Geophys 40: 1-41
s7 Venables WN, Ripley BD (2002) Modern applied statistics with S. New York:
Springer. 495 p.
s8 Maraun D Kurths J (2004) Cross wavelet analysis: significance testing and pitfalls.
Nonlinear Proc Geoph. 11: 505-514
s9 Torrence C, Compo G (1998) A practical guide to wavelet analysis. Bull Am Meteor
Soc 79: 61-78.
s10 Durbin J, Koopman SJ (2001) Time Series Analysis by State Space Methods.
Oxford: Oxford University Press.


