18th European Symposium on Computer Aided Process Engineering – ESCAPE 18
Bertrand Braunschweig and Xavier Joulia (Editors)
© 2008 Elsevier B.V./Ltd. All rights reserved.
Composite zeolite membranes characterization by
using a transient state experimental technique and
a parameter estimation procedure
Lucile Courthial,a Arnaud Baudot,a Mélaz Tayakout-Fayolle,a Christian Jallutb
a
IFP-Lyon, BP 3, 69390 Vernaison, France
Université de Lyon, Université Lyon 1, Laboratoire d’Automatique et de Génie des
Procédés-UMR CNRS 5007,ESCPE, 43 Bd du 11 Novembre 1918, 69622 Villeurbanne,
France
b
Abstract
We describe a non-destructive transient state method for the determination of
thermodynamic and transport properties of zeolite composite membranes. The
properties under consideration are included as parameters of a linear dynamic model of
the membrane. The parameters values are obtained thanks to an estimation procedure
based on the comparison between simulated and measurements realized in the linear
domain. A step-by-step experimental procedure is derived from a structural
identifiability analysis of a simplified linear model of the membrane. A more detailed
linear model is then used for the estimation procedure. Due to its transient nature, this
technique allows the zeolite selective layer effective thickness determination as well as
that of thermodynamic and transport properties of sorbing hydrocarbons. Some
examples of results are given to illustrate the capabilities of the technique.
Keywords: membrane,
identifiability
dynamic
modelling,
parameter
estimation,
structural
1. Description of the system
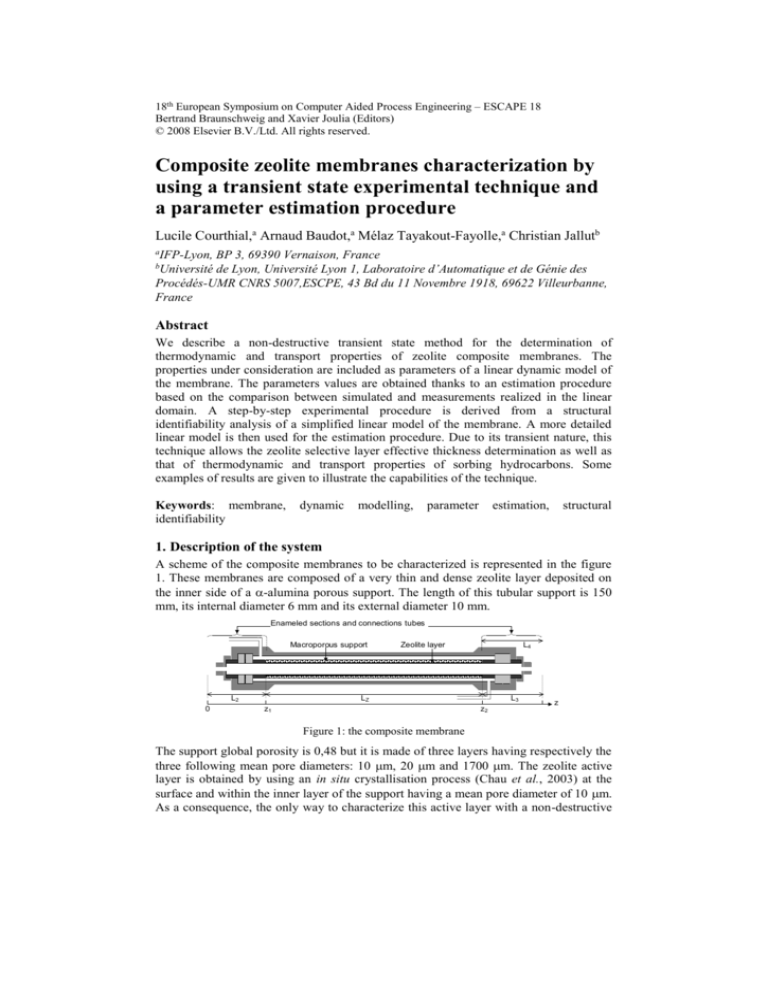
A scheme of the composite membranes to be characterized is represented in the figure
1. These membranes are composed of a very thin and dense zeolite layer deposited on
the inner side of a -alumina porous support. The length of this tubular support is 150
mm, its internal diameter 6 mm and its external diameter 10 mm.
Enameled sections and connections tubes
Macroporous support
L2
0
Zeolite layer
L4
LZ
z1
L3
z2
z
Figure 1: the composite membrane
The support global porosity is 0,48 but it is made of three layers having respectively the
three following mean pore diameters: 10 m, 20 m and 1700 m. The zeolite active
layer is obtained by using an in situ crystallisation process (Chau et al., 2003) at the
surface and within the inner layer of the support having a mean pore diameter of 10 m.
As a consequence, the only way to characterize this active layer with a non-destructive
2
L. Courthial et al.
macroscopic method is to perform experiments by using the membrane as it is
represented in the figure 1. In this paper, we describe the way transient experiments
similar to the transient version of the well-known Wicke-Kallenbach diffusion cell can
be done according to the principle that is represented in figure 2 (Bakker et al., 1996;
Sun et al., 1996; Tayakout-Fayolle et al., 1997; Courthial et al., 2006; Courthial, 2007).
zeolite layer
inner compartment
outer compartment
macroporous support
Figure 2: principle of the transient experiments
A fixed composition gaseous mixture flows through the outer and inner compartments
of the membrane. The initial conditions are established when the thermodynamic
equilibrium is reached. The inlet composition of the inner compartment feed gas is then
suddenly modified and the time evolution of the two outlet compositions is measured.
We use a concentration pulse injection and we verify that its intensity is sufficiently low
so that experiments are performed in the linear domain of the system. The abovedescribed experiments can be performed with pure components or mixtures.
Furthermore, one can vary the concentrations of the gases at the initial equilibrium state
in order to study the evolution of the parameters with the zeolite active layer loading
and composition according to the approach that is used in inverse chromatography
(Tondeur et al., 1996; Jolimaitre et al., 2001). We use the capabilities of a gas phase
chromatograph and an infrared analyzer to perform the experiments (see Courthial,
2007 for more details about the experimental set-up).
2. Structural identifiability study for pure component experiments
The estimation procedure is based on a linear state model of the system. One has to
check for the structural identifiability of its parameters. It has been previously shown
that when linear or non linear state models are derived for chromatographic columns
(Tayakout-Fayolle et al., 2000; Couenne et al., 2005), the solid phase composition
should not be represented by the ordinary concentration q but by the concentration of a
*
gas phase C that would be at equilibrium with the solid phase at each point and at each
time. A simple examination of a state model written according to the classical choice of
state coordinate q cannot lead to the conclusion that it is overparametrized and to
strategy. In order to check for the
propose an adapted experimental estimation
pertinence of the proposed change of state coordinate in the case of the composite
membrane, a simplified version of the model is used in order to apply the transfer
function
technique (Walter and Pronzato, 1997). Since the result is based on the way the
adsorbent composition in the zeolite is represented, we assume that the main conclusion
of the structural identifiability study will be valid for the more realistic model that is
used to perform the parameter estimation.
2.1. A simplified linear model of the system
In this model, we have neglected the axial dispersion in the gas flows as well as the
zeolite layer curvature. Furthermore, the macro-porous support is not taken into
Composite zeolite membranes characterization by using a transient state experimental
technique and a parameter estimation procedure
consideration and we take into account only the part of the membrane situated between
z1 and z2 (see figure 1). The equilibrium condition between the zeolite layer and the gas
phase is represented by the Henry law qr,t A C r,t with C r,t the adsorbate
concentration of a gas phase that would be at equilibrium with the zeolite. Once the
r Ri
z z1
dimensionless coordinates are defined – ie –
and
where Lz is the
Lz
ez
zeolite active layer length, ez its thickness and R i its internal radius, the dimensionless
adsorbate balance equations for the inner and outer gas phases as well as for the zeolite
are as follows:
*
C i
1
t L
i
C o 1
L
o
t
C i
z
C o
z
C 0, t
*
a i Bz
Boundary conditions :
C i 0,t C i0 t
C o 0,t 0
a o k o C o C 1, t
*
*
(1)
Boundary conditions :
C
t
*
2 *
1 C
z 2
C * 0,t C i ,t
*
C
k
1,t o C o C * 1, t
Bz
C i and C o are the inner and outer compartments gas phase concentrations, Bz
(2)
A Dz
ez
included in the boundary condition of the zeolite layer inner
is a mass transfer resistance
2
surface. z
ez
is the diffusion time constant. a i and a o are the specific surface areas
Dz
of the active layer and k o a mass transfer coefficient between the outer gas flow and the
active layer surface. As far as the inner surface of the active layer is concerned, it is
assumed to be at equilibrium with the
gas phase
(see figure 1).
function analysis
2.2. Transfer
The derivation of the transfer function is very long and we only give the result for the
transfer function between the inlet concentration of the inner compartment and the
outlet concentration of the outer compartment (see figure 2) as an example (see the
appendix):
L
Cˆ o s
G s 0
Cˆ i s
z
Cˆ o 1,s
Ds
r s
r s
e
e
ˆ
C i 0,s r1 s r2 s
1
2
(3)
These expressions show that the same macroparameters including the initial
microparameters (Walter and Pronzato, 1197) appear in the state model and in the
corresponding transfer functions. As a consequence, the state model is correctly
3
4
L. Courthial et al.
2
parametrized. As far as the active layer is concerned, only z
ez
Dz
and Bz
A Dz
ez
are structurally identifiable.
2.3. A step-by-step experimental procedure
ez and the diffusion
layer thickness
In order to get the Henry constant A , the zeolite
coefficient Dz , we propose to first use a tracer that is not adsorbed in the zeolite. In this
case, A 1 and the layer effective thickness can be determined as well as the tracer
diffusion coefficient in the zeolite. The latter can be used to check for the results. Once
z can be obtained for a given adsorbate
from the estimations of
ez is known, A and D
2
z
ez
Dz
and Bz
A Dz
ez
.
of results for a pure adsorbate
3. Examples
We present here some results concerning membranes that has been obtained at IFP from
anaqueous solution containing the following species: SiO2/tetrapropyle ammonium
hydroxyde/H2O (Chau et al., 2003).
3.1. The linear model of the system for the parameter estimation
We use a more realistic model than the one used for the identifiablity study for the
membrane as it is represented in the figure 1. The main features of this model are the
followings:
the diffusion within the macroporous support is taken into account;
the curvature of the crystal layer is taken into account;
axial dispersion is included in the gas flows model;
the tubes connected to the system are included in the model. They are represented
by CSTR’s or plug flow- axial dispersion models.
The parameters of the flow models have been estimated from experiments where the
membrane was replaced by a stainless steel tube. We don’t present this part of the study
here (see Courthial, 2007). The volume of the connection tubes is about 9 % of the total
volume of the system and we have checked for the consistency of the estimated axial
dispersion coefficients with respect to literature.
3.2. Estimation of the active layer effective thickness by using hydrogen as tracer
One can see in the figure 3a an example of time domain fitting that is obtained in this
case. In the figure 3b is shown the stability of the effective thickness estimation
according to different operating conditions (gas flow rates and temperature). From the
results represented in the figure 3b, the effective thickness of the active layer of the
membrane under consideration is ez 26 4 m . This result is consistent with
previous knowledge about this membrane.
3.3. Properties of the membranes with respect to pure n-butane
In the figure 4a is shown
an example of time domain fitting that is obtained for the nbutane at 200 °C. One can see in the figure 4b the evolution of the n-butane diffusion
coefficient through the zeolite layer as a function of the gas phase concentration of n-
Composite zeolite membranes characterization by using a transient state experimental
technique and a parameter estimation procedure
0.6
4.5E-5
4.0E-5
0.5
3.5E-5
Estimation:
0.4
0.3
D z = 6.12x10
-9
m 2 .s -1
3.0E-5
e z = 2.55x10
-5
m 2.s -1
2.5E-5
k
k
0.2
s
o
-1
= 0.963 m.s
= 2.70x10
ez (m)
Concentration (mol.m- 3 )ZZZZ
butane at the initial equilibrium state. The mean confidence interval that is obtained for
these estimations is 10 %.
-2
m.s
-1
2.0E-5
1.5E-5
1.0E-5
0.1
5.0E-6
0.0E+0
0.0
0
2
4
6
8
0
10
Time (s)
1
2
Volumetric flow rate (cm
(a)
3
4
3
.s-1)
(b)
Figure 3: estimation procedure for the zeolite layer thickness
1.0E-8
Estimation:
0.25
0.20
D z = 3.69x10
-10
e z = 2.58x10
-5
m
k s = 0.700 m.s
-1
k o = 7.09x10
-3
m 2.s -1
m.s -1
0.15
0.10
9.0E-9
Dz (m 2.s - 1 )zzzz
Concentration (mol.m-3)zzzzz
0.30
8.0E-9
7.0E-9
6.0E-9
5.0E-9
4.0E-9
3.0E-9
0.05
2.0E-9
0.00
0.0E+0
1.0E-9
0
5
10
15
Volumetric flow rate (s)
(a)
20
0
5
10
15
20
CI = C E (mol.m -3)
(b)
Figure 4: properties of the membrane with respect to n-butane at 200 °C
The method turns to be sensitive since we find that the diffusion coefficient of the nbutane increases with the zeolite loading as it is well known in this domain (Jolimaitre
et al., 2001).
4. Conclusion
In this paper, we have shown how to derive a transient state technique for the
characterization of zeolite composite membranes from a structural identifiability study.
Since the three parameters of interest are included into two macroparameters that are
structurally identifiable, we have designed a step-by-step procedure. The first step is the
determination of the zeolite active layer by using an inert tracer. Then, the equilibrium
and the diffusion coefficients can be obtained by performing transient experiments with
sorbing hydrocarbons. We have shown some results that have been obtained for a pure
adsorbate to illustrate the capabilities of the technique.
5
6
L. Courthial et al.
Appendix
The quantities present in the transfer function Eq. 3 are as follows:
lo
Bz
ko
As
z s , r1 s
iL
z
As C s s
2
s 2ai Bz
1 lo e
Bs 2 iL ai Bz
1 lo e
s
z
2
and
zs
z
z
1 lo e
s
z
e s e s
L
Cs o s ao ko1
1 lo e s 1 lo e
lo
.
Ds 2 oL ao ko
s
1 lo e 1 lo e s
z
A s C s s
s
1 lo e s
zs
z
, r2 s
z
z
z
s
z
z
z
z
References
W. J. W. Bakker, F. Kapteijn, J. Poppe, J. A. Moulijn, 1996, Permeation characteristics of a
metal-supported silicalite-1 zeolite membrane, Journal of Membrane Science, 117, 57-78
F. Couenne, C. Jallut, M. Tayakout-Fayolle, 2005, On minimal representation of heterogeneous
mass transfer for simulation and parameter estimation: application to breakthrough curves
exploitation, Computers and Chemical Engineering, 30, 42-53
L. Courthial, 2007, Caractérisation des propriétés physico-chimiques et morphologiques des
membranes zéolithes par mesure de perméation en régime transitoire, PhD Thesis, Lyon I
University
L. Courthial, A. Baudot, E. Jolimaitre, M. Tayakout-Fayolle, C. Jallut, 2006, Moments method
applied to the in-situ characterisation of normal butane mass transfer in MFI zeolite
membranes, Desalination, 193, 215-223
C. Chau, I. Prevost, J. A. Dalmon, S. Miachon, 2003, Process for preparing supported zeolitic
membranes by temperature-controlled crystallisation. US Patent, 6582495 B2
E. Jolimaitre, M. Tayakout-Fayolle, C. Jallut, K. Ragil, 2001, Determination of mass transfer and
thermodynamic properties of branched paraffins in silicalite by inverse chromatography
technique, IEC Res., 40, 914-926
M. S. Sun, O. Talu, D. B. Shah, 1996, Diffusion measurements through embedded zeolite cristal.
AIChE Journal, 42, 3001-3007
M. Tayakout-Fayolle, C. Jallut, F. Lefèvre, J. A. Dalmon, 1997, Application of transient methods
to measurements of mass transfer parameters in zeolitic membranes, ECCE1, First European
Congress on Chemical Engineering, Florence, Italy, May 4-7-1997, 2, 1209-1212
M. Tayakout-Fayolle, E. Jolimaitre, C. Jallut, 2000, Consequence of structural identifiability
properties on state-model formulation for linear inverse chromatography, Chemical
Engineering Science, 55, 2945-2956
D. Tondeur, H. Kabir, L. A. Luo, J. Granger, 1996, Multicomponent adsorption equilibria from
impulse response chromatography, Chemical Engineering Science, 51, 3781-3799
E. Walter, L. Pronzato, 1997, Identification of parametric models from experimental data.
Springer


