Solution to Exam 3_1
advertisement

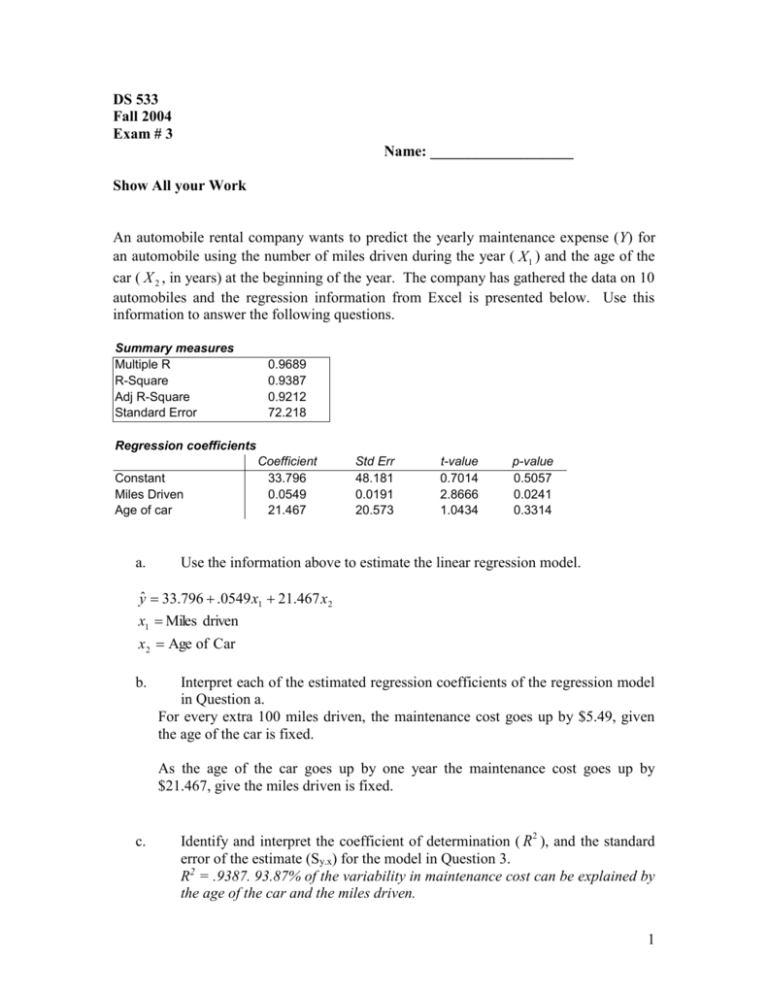
DS 533 Fall 2004 Exam # 3 Name: ___________________ Show All your Work An automobile rental company wants to predict the yearly maintenance expense (Y) for an automobile using the number of miles driven during the year ( X1 ) and the age of the car ( X 2 , in years) at the beginning of the year. The company has gathered the data on 10 automobiles and the regression information from Excel is presented below. Use this information to answer the following questions. Summary measures Multiple R R-Square Adj R-Square Standard Error 0.9689 0.9387 0.9212 72.218 Regression coefficients Constant Miles Driven Age of car a. Coefficient 33.796 0.0549 21.467 Std Err 48.181 0.0191 20.573 t-value 0.7014 2.8666 1.0434 p-value 0.5057 0.0241 0.3314 Use the information above to estimate the linear regression model. yˆ 33.796 .0549 x1 21.467 x 2 x1 Miles driven x 2 Age of Car b. Interpret each of the estimated regression coefficients of the regression model in Question a. For every extra 100 miles driven, the maintenance cost goes up by $5.49, given the age of the car is fixed. As the age of the car goes up by one year the maintenance cost goes up by $21.467, give the miles driven is fixed. c. Identify and interpret the coefficient of determination ( R2 ), and the standard error of the estimate (Sy.x) for the model in Question 3. R2 = .9387. 93.87% of the variability in maintenance cost can be explained by the age of the car and the miles driven. 1 S = 72.218. This measures the variability around the fitted model. d. Does the given set of explanatory variables do a good job of explaining changes in the maintenance costs? Explain why or why not. The R2 is high, indicating a good model, but the variable age of the car is not a significant predictor of the maintenance car given the first variable (Miles driven) in the model. The variable age of the car may not be needed in the model. d. Would you recommend that this company examine any other factors to predict maintenance expense? If yes, what other factors would you want to consider? Explain your answer. This is a good model with R2 = 94%. Other variable that may be considered is the make and model of the car. f. Give a 95% confidence interval for the average yearly maintenance cost for an automobile for every extra mile driven during the year ( X1 ). b1 t * SE (b1 ) .0549 2.365(.0191) .0549 .045 (.010, .10) g. What is the average yearly maintenance cost for a 10-year-old automobile that drives 12000 miles per year? yˆ 33.796 .0549 x1 21.467 x 2 yˆ 33.796 .0549(12000) 21.467(10) 873.47 2 Mid-Valley Travel Agency (MVTA) has offices in 12 cities. The company believes that its monthly airline bookings are related to the mean income in those cities and has collected the following data: Location Bookings 1 1098 2 1131 3 1120 4 1142 5 971 6 1403 7 855 8 1054 9 1081 10 982 11 1098 12 1387 Income 43299 45021 40290 41893 30620 48105 27482 33025 34687 28725 37892 46198 The data are analyzed using regression analysis. The partial computer output is given below: SUMMARY OUTPUT Regression Statistics Multiple R 0.879189 R Square 0.772974 Adjusted R Square 0.750271 Standard Error 78.16735 Observations 12 ANOVA df Regression Residual Total 1 10 11 Intercept X Variable 1 a) SS MS F 208036.3 208036.3 34.04775 61101.35 6110.135 269137.7 Coefficients Standard Error t Stat P-value 371.6758 128.5571 2.891133 0.016076 0.019381 0.003322 What is the estimated least square regression line? yˆ 371.6758 .019 x 3 b) What is the standard error of the estimate? S =78.167 c) Forecast the number of bookings when the mean income is $51385. yˆ 371.6758 (.019)(51385) 1347.99 d) Test the significance of the regression coefficient at the 5% level (state the null and alternative hypothesis, the value of your test statistic, the p-value or the decision rule, and your conclusion). H0 : 1 = 0 Ha ; 1 ≠ 0 T .019 5.72 .003322 P-value < 2(.005) = .01 Reject H0. Mean income is a significant predictor of the air line bookings. e) Give an interval estimate of 1 with a 95% confidence coefficient. b1 t * SE (b1 ) .019 (2.23)(. 003322) .019 .00741 (.0116, .026) 4 Multiple Choice Questions Select the best answer 1. In choosing the “best-fitting” line through a set of points in linear regression, we choose the one with the: a. b. c. d. e. smallest sum of squared residuals ** largest sum of squared residuals smallest number of outliers largest number of points on the line none of the above 2. In a multiple regression analysis, there are 25 data points and 5 independent variables, and the sum of the squared differences between observed and predicted values of y is 160. The regression standard error will be: a. b. c. d. e. 2.530 3.464 2.902** 5.657 none of the above 3. In a simple linear regression analysis, the following sum of squares are produced: ( y y) i 2 400, (y yˆ ) i 2 80, (yˆ y ) i 2 320 The proportion of the variation in y that is explained by the variation in x is: a. b. c. d. e. 20% 80%** 25% 50% none of the above 4. Given the least squares regression line ŷ 8 – 3x, a. b. c. d. e. the relationship between x and y is positive the relationship between x and y is negative** as x increases, so does y as x decreases, so does y there is no relationship between x and y 5 5. A multiple regression equation includes 6 independent variables, and the coefficient of multiple determination is 0.91. The percentage of the variation in y that is explained by the regression equation is: a. b. c. d. e. A “fan” shape in a scatterplot indicates: 6. a. b. c. d. 7. 91%** 95% 83% about 15% none of the above unequal variance** a nonlinear relationship he absence of outliers sampling error The values of the regression parameters i are not known. We estimate them from the data. a) True ** b) false c) Not enough information 8. Residual plots can be used to check the aptness of the model for the data. a) True** b) False c) Not enough information 9. We need to estimate the variance of the error terms because: I) It gives an indication of the variability of the distribution of y. II) It is needed for making inference concerning regression function and the prediction of y. a) Only (I) is true. b) Only (II) is true. c) Both (I) and (II) are true.** d) Neither (I) nor (II) is true. 6


