Interpreting Excel Regression Output: A Guide
advertisement

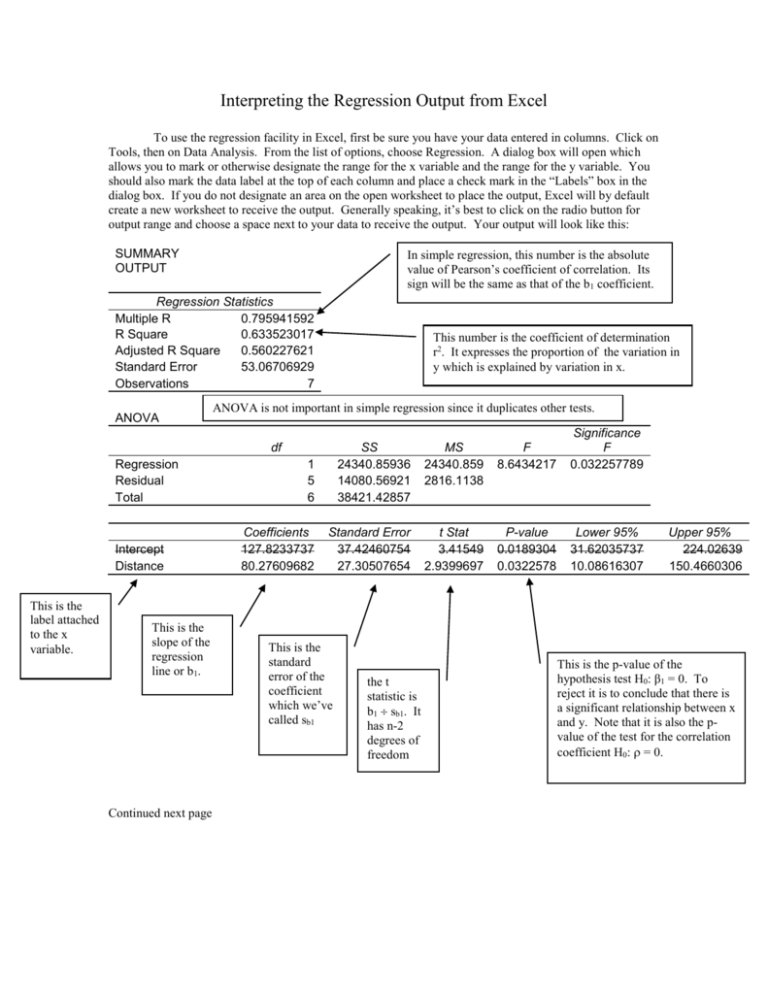
Interpreting the Regression Output from Excel To use the regression facility in Excel, first be sure you have your data entered in columns. Click on Tools, then on Data Analysis. From the list of options, choose Regression. A dialog box will open which allows you to mark or otherwise designate the range for the x variable and the range for the y variable. You should also mark the data label at the top of each column and place a check mark in the “Labels” box in the dialog box. If you do not designate an area on the open worksheet to place the output, Excel will by default create a new worksheet to receive the output. Generally speaking, it’s best to click on the radio button for output range and choose a space next to your data to receive the output. Your output will look like this: SUMMARY OUTPUT In simple regression, this number is the absolute value of Pearson’s coefficient of correlation. Its sign will be the same as that of the b1 coefficient. Regression Statistics Multiple R 0.795941592 R Square 0.633523017 Adjusted R Square 0.560227621 Standard Error 53.06706929 Observations 7 ANOVA This number is the coefficient of determination r2. It expresses the proportion of the variation in y which is explained by variation in x. ANOVA is not important in simple regression since it duplicates other tests. 1 5 6 SS 24340.85936 14080.56921 38421.42857 MS 24340.859 2816.1138 F 8.6434217 Significance F 0.032257789 Coefficients 127.8233737 80.27609682 Standard Error 37.42460754 27.30507654 t Stat 3.41549 2.9399697 P-value 0.0189304 0.0322578 Lower 95% 31.62035737 10.08616307 df Regression Residual Total Intercept Distance This is the label attached to the x variable. This is the slope of the regression line or b1. Continued next page This is the standard error of the coefficient which we’ve called sb1 the t statistic is b1 sb1. It has n-2 degrees of freedom Upper 95% 224.02639 150.4660306 This is the p-value of the hypothesis test H0: β1 = 0. To reject it is to conclude that there is a significant relationship between x and y. Note that it is also the pvalue of the test for the correlation coefficient H0: = 0. SUMMARY OUTPUT Regression Statistics Multiple R 0.795941592 R Square 0.633523017 Adjusted R Square 0.560227621 Standard Error 53.06706929 Observations 7 This is the standard error of the estimate, which we’ve designated sy.x. The number of observations or n. ANOVA 1 5 6 SS 24340.85936 14080.56921 38421.42857 MS 24340.859 2816.1138 F 8.6434217 Significance F 0.032257789 Coefficients 127.8233737 80.27609682 Standard Error 37.42460754 27.30507654 t Stat 3.41549 2.9399697 P-value 0.0189304 0.0322578 Lower 95% 31.62035737 10.08616307 df Regression Residual Total Intercept Distance We’ve struck through the line of information for Intercept to emphasize that these numbers are rarely of interest in themselves. Although the intercept is used as b0 in the regression equation and in making predictions, we do not usually test H0: β0 = 0. These numbers are the limits of a confidence interval for the slope of the regression line: we are 95% confidenct that 10.09 β1 150.47. Upper 95% 224.02639 150.4660306


