Comparison of the Input Muon Distributions used for CDMS Neutron
Comparison of the Input Muon Distributions used for CDMS Neutron Simulations
P. Cushman December 20, 2006
1. Introduction
The muon angular distribution and flux at Soudan are required input for the cosmogenic neutron Monte Carlo. Fluka assumes an effectively shallower location than Geant with more muons. Since the input muon distribution may be responsible for 20-40% of the differences in the neutron background calculated via the 2 Monte Carlos, it would be useful to eliminate that additional degree of freedom, especially if we plan to write a paper on this. The purpose of this note is to summarize the situation and suggest a new, more precise formulation that should be the starting point of all new Monte Carlos.
2. Current Monte Carlo Choices
The Geant4 MC starts with a parameterization based on Groom (see Cassiday et al., Phys
Rev D7 , Vol 7, pp2022-31) where a nominal flat overburden of 2100 mwe was assumed.
If we plug in the numbers, this would give a vertical flux of 1.2 x 10
-3
m
-2
sr
-1
s
-1 for standard rock. The measured Soudan vertical flux is 1.03 x 10
-3
m
-2
sr
-1
s
-1 which corresponds to 1.15 x 10
-3
m
-2
sr
-1
s
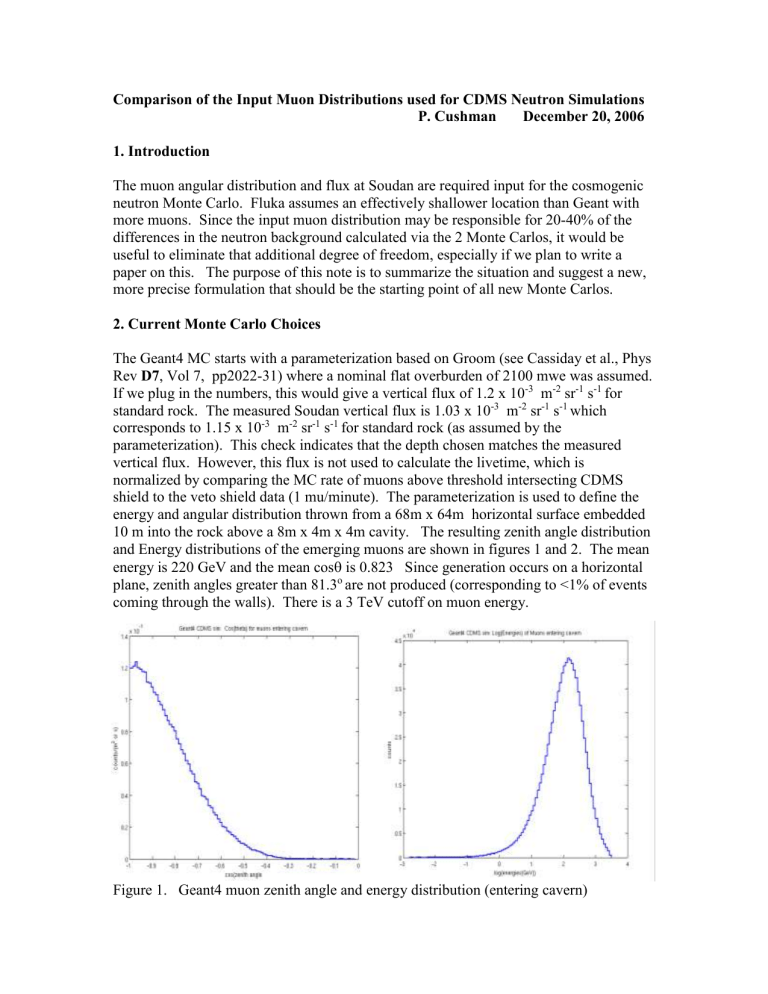
-1 for standard rock (as assumed by the parameterization). This check indicates that the depth chosen matches the measured vertical flux. However, this flux is not used to calculate the livetime, which is normalized by comparing the MC rate of muons above threshold intersecting CDMS shield to the veto shield data (1 mu/minute). The parameterization is used to define the energy and angular distribution thrown from a 68m x 64m horizontal surface embedded
10 m into the rock above a 8m x 4m x 4m cavity. The resulting zenith angle distribution and Energy distributions of the emerging muons are shown in figures 1 and 2. The mean energy is 220 GeV and the mean cos
is 0.823 Since generation occurs on a horizontal plane, zenith angles greater than 81.3
o are not produced (corresponding to <1% of events coming through the walls). There is a 3 TeV cutoff on muon energy.
Figure 1. Geant4 muon zenith angle and energy distribution (entering cavern)
The FLUKA distribution follows the model suggested by SteveYellin, http://cdms.berkeley.edu/cdms_restricted/cdmsnotes/0407/0407001/muonbox.ps
where the angular distribution is generated in order to match the angular distribution measured by Robert Nelson in his senior undergraduate thesis found at http://cdms.berkeley.edu/cdms_restricted/cdmsnotes/0307/0307001/R.Nelson_thesis.pdf
Nelson obtained n= 3.28 (0.13) when fitting to cos n mwe overburden when fitted to Miyake (PICRC 5
, which corresponds to an h =1973
, 1973) n = 1.53 + (8x10
-4
) h +
.
However, according to Barbouti and Rastin (J. Phys. G9 , 1577 (1983)), a 1973 mwe overburden would predict a vertical flux of 1.23 x 10
-3
m
-2 sr
-1 s
-1
, instead of the 1.86 x 10
-
3
m
-2 sr
-1 s
-1
(with a +3% and -7% uncertainty) that Nelson measured. Yellin then renormalizes the flux upward by 1.5 to match Nelson’s flux measurement. This flux is used to normalize the muon rate coming into the cavern and calculate the livetime in the detector. This yields the angular distribution and energy spectrum shown in figures 3 and
4. The distribution is thrown from vertical and horizontal surfaces and does not have a zenith angle cutoff. The mean energy is 242.8 GeV and the mean cos
is 0.8076
Figure 2. Fluka muon zenith angle and energy distribution (entering detector)
In this model, the flux by itself corresponds to 1756 mwe and the angular distribution to
1973 mwe. The discrepancy between the 2 overburdens is defended by suggesting that the excavations above Soudan reduce the vertical equivalent depth, while keeping an angular profile that resembles deeper sites. As you will see below, the opposite is more nearly true. Also, recall that the zenith angle distribution was not actually measured by
R. Nelson as a function of theta, but by deconvolution of the width of the Landau distribution. Both Geant4 and Fluka simulations assume a uniform azimuthal distribution. When displayed as linear plots, they look very similar, but we will look more closely below.
Neither of the above distributions matches that chosen by Mei & Hime. They do a global fit to data for muon intensity vs slant depth “h”, using the Groom model and report new values for the parameters. They then move to a fit of mu intensity vs vertical depth “h o
” using only sites with flat overburdens (Soudan is considered a flat site) and get a parameterization. Plugging 2100 mwe into their expression gives 1.45 x 10
-3
m
-2 sr
-1 s
-1 for the vertical muon flux. At Soudan depth, their fit gives a mean energy (over all angles) of 191 GeV (Lipari parameters) and 212 GeV (Groom parameters) with an accuracy of 7%. Thus, their thrown muons are similar in angular distribution to Geant4, but with a flux halfway between Geant4 and Fluka.
3. Soudan Details
If we want to do better, we need to take account of the detailed structure of Soudan, even if we decide to average it out at the end, if only to determine which zenith angle distribution is closer to reality. The lab is situated under a 50 m high ridge running E-W.
The ore bodies are pure hematite (69% iron) embedded in “iron formation” rock which is itself 30% iron. The iron formation runs E-W in an almost vertical band 100 m thick.
The rest of the rock is mostly Ely greenstone with
~ 2.75-2.95 g/cm 3 and <Z/A> =
0.495 ; <Z
2 /A> = 6.10 This can be compared to “standard rock” (usually coded as SiO, typical of granite) with
= 2.65 g/cm
3
and <Z/A> = 0.5 and <Z
2
/A> = 5.5. Thus, the muon fluxes in the E-W direction are 30% lower because of both the ridge and the iron.
In the N-S direction, muon rate from the north is 20% more than from the south. This can be accomodated by assigning 5% less density to the rock to the north compared to the south. Recall that Lake Vermillion is to the north.
Since it is difficult to physically determine the composition of the rock overburden through sampling and/or available geological maps, an alternative method of measuring the rock density and composition was developed by the Soudan 2 collaboration and is found in Sue Kasahara’s thesis ( http://www.hep.umn.edu/theses/kasahara.ps.gz
). She did a fit to a parameterization of muon intensity data using a large body of Soudan 2 muon data collected during the period June, 1991 to March, 1996. The effective rock density was determined in 337 angular bins covering the angular region 15-60 degrees in zenith and 10-80 degrees in azimuth for each azimuthal quadrant. The angular regions not considered in her analysis (due to low Soudan 2 trigger and/or reconstruction efficiency) were taken from the nearest available angular bin in an averaged manner. The density values are folded into the surface elevation values and given as a function of
(zenith,azimuth) in the linked ascii table.
Currently MINOS generates muon distributions (E/theta/phi) differently depending on the direction they enter the cavern, based on this slant path table. There is a separate file for each detector face (top, E,W,N,S) - the first thing the generator does is figure out which face the muon enters based relative total rates. Once that is determined, a random location on the face is picked, and the proper histograms are used to pick theta and phi.
The energy spectrum is theta dependant, and this is handled crudely by having separate energy histrograms for various theta intervals. There are 10 energy histograms in all, each covering 10 degrees in theta. This file is linked here.
Figure 3. Geographic details and azimuthal angle structure at Soudan Lab
When the slant path table is averaged over azimuth and plotted as a function of zenith angle, the effect of the ridge is smeared out, but the average slant path is still significantly reduced for muons at large zenith angles, as shown in figure 4.
Figure 4. Slant depth (which includes geographical and rock density) normalized to effective vertical depth.
Figure 5. Zenith angle dependence of Soudan Monte Carlo (integrated over azimuth) compared to the best “Gaisser type” fit for flat overburden zenith angle dependence.
Another way to see this is to plot the zenith angle dependence of the flux (figure 5). The vertical flux I v is the y-intercept at 1 - cos
= 0 and is very close to the older measurements by Ruddick (NUMI note 210) of I v
=1.03 x 10
-3
m
-2 sr
-1 s
-1
. The best flat overburden fit is superposed. Notice the clear deficit at zero zenith angle. The form of the fit is not cos n , but instead is derived from Gaisser’s formula for differential muon flux (see appendix). It is similar to the form Miyake (Menon et al, Proc.Phys. Soc. 90 ,
649 (1967)) recommends as a better fit than cos n
What you do not see plotted is the data from muon tracks as analyzed from the Soudan1 and Soudan2 experiments from which the Monte Carlo is derived because that lies right over the Monte Carlo.
The same Monte Carlo is plotted as a set of points in figure 6 (statistical error bars are about the size of the dots). Overlaid on this is the cos n
fit with Robert’s numbers (red dotted) and the same curve normalized upward to fit a higher flux and used as input to
Fluka (red solid). The blue solid curve is the Geant4 input. Neither do a very good job: the Geant4 flat overburden assumption falls off too quickly in zenith angle and the Fluka overestimates the vertical flux and doesn’t fall off quickly enough.
Figure 6. Comparison of the R. Nelson cos n
fits and Geant4 Monte Carlo muon zenith angle distributions to the Soudan Monte Carlo derived from detailed azimuthal data (and then averaged over the azimuth). The Soudan data lies on this curve.
Can we reconcile Robert Nelson’s measurements with the Soudan measurements?
Possibly. The measurements consist of 2 parts: an energy distribution and a total flux.
The energy distribution measured included a number of corner clippers which showed up below the Landau peak and were cut out of the distribution. Since these are more likely to be at an angle, it may be that his peak was consequently too narrow. He should have gotten a wider peak corresponding to a shallower than expected depth because of the
“sideways” muons coming in from either side of the ridge. If so, then his fitted n would have been smaller.
For the flux measurement, what he really measures is the rate R through a horizontal surface, from which he derives
R/A(N/n) where A is the area of the scintillator and
(N/n) is an acceptance calculated using a Monte Carlo which throws muons according to the (cos
n
distribution found from his first measurement, thus linking the two processes.
Perhaps because of this cross-over, his answer of
= 2.21x10
-3
m
-2 s
-1
is 20% higher than the current muon flux through a horizontal surface (re-measured by MINOS and consistent with Ruddick) of 1.77x10
-3
m
-2 s
-1
. He then derives a model-dependent
“vertical flux” I v
I v
=
2
/(n+2)] -1 = 1.86x10
-3 m -2 s -1 sr -1 which he compares to
(Ruddick) = 1.03x10
-3 m -2 s -1 sr -1 and finds an 11
discrepancy. This should not bother us, since we have already shown why the Soudan muon flux is not as vertical as expected for this depth. One might also point out an arithmetic error in the paper: setting the
Soudan ratio for
/Iv = 1.75 sr-1 = 2
/(n+2) does not give n=2.6, but n=1.6 instead which corresponds to a depth of 87 mwe (parameterization not even valid at this depth) and not 1330 mwe. So the discrepancy is even worse than reported if one tries to maintain the simplistic cos n
approach to fitting.
4. Further Improvements
Vitaly Kudryavtsev has kindly used his MUSIC code to create a muon distribution for
CDMS based on the Soudan slant paths. Since the slant paths correct for the addition of iron ore bodies, MUSIC starts with Ely Greenstone. The inputs which I sent him were density=2.8 g/cm
3
, Z = 12.117, A = 24.429. The best starting point for a flat overburden model before modulating with slant paths is a depth near the lower zenith angle end where the distribution peaks underground (I chose 700 m). The results of his Monte
Carlo are now available for use and a few distributions from the files are shown below in figure 7. They could be used to generate muons in the rock on horizontal and vertical surfaces to be used in future Monte Carlos so both Fluka and Geant4 use the same input.
Alternatively, some sort of benchmark study could be done to establish how to scale the existing MC work (which, after all, represents a not inconsiderable accumulation of livetime) should be appropriately scaled to each other and the more exact muon distribution.
In summary, Geant4 assumes a flat overburden at the Soudan ridge depth, which results in fewer large angle muons with harder energy spectra. Thus, while figure 6 shows that
Geant4 underestimates the number of muons at large zenith angles, figure 11 shows how those same muons have higher energies. Fluka effectively assumes a 217 m deep bowllike depression above CDMS rising to a flat overburden only127 m shallower than the ridge. Thus Fluka matches the mid-zenith angle muon flux, but generates more downward-going muons with higher energy. The azimuthal dependence may be important, since CDMS is not symmetrically located in the cavern. Even if it isn’t, the zenith angle dependence can be corrected most naturally by simply incorporating the existing slant path dependencies in generating the wall and ceiling muon distributions in the Monte Carlo.
Figure 7. Angular distribution and energy distribution of muons generated via MUSIC.
= 180 o
= 270 o
= 0
= 90 o
Figure 8. Coordinate system of the Soudan Detector and the various MC o
Figure 9. Further interesting plots from the Soudan Muon Monte Carlo.
Figure 10. Fits to the muon energy spectrum through a flat surfaces (ceiling and wall).
The dots are the Soudan Monte Carlo. The MUSIC code matches this quite well.
Figure 11. Comparison of the energy spectrum fit from figure 10 (Soudan MC) to the
Geant4 Monte Carlo flux through ceiling and walls of the cavern. In order to emphasize the difference in the shape, the Soudan fitted curve simply intersects the Geant4 curve at the low energy end. Normalizing to the area is not a proper way to compare the curves either, since the total number of muons is reduced under the assumption of a flat overburden. Despite the high energy tails, the Geant4 average muon energy matches the
Soudan average energy, whereas the Fluka is 10% high due to a shallower effective depth.
Appendix
Derivation of the form of the zenith angle dependence at depth
