Theory of Diddusion-Influenced Reaction Rates
advertisement
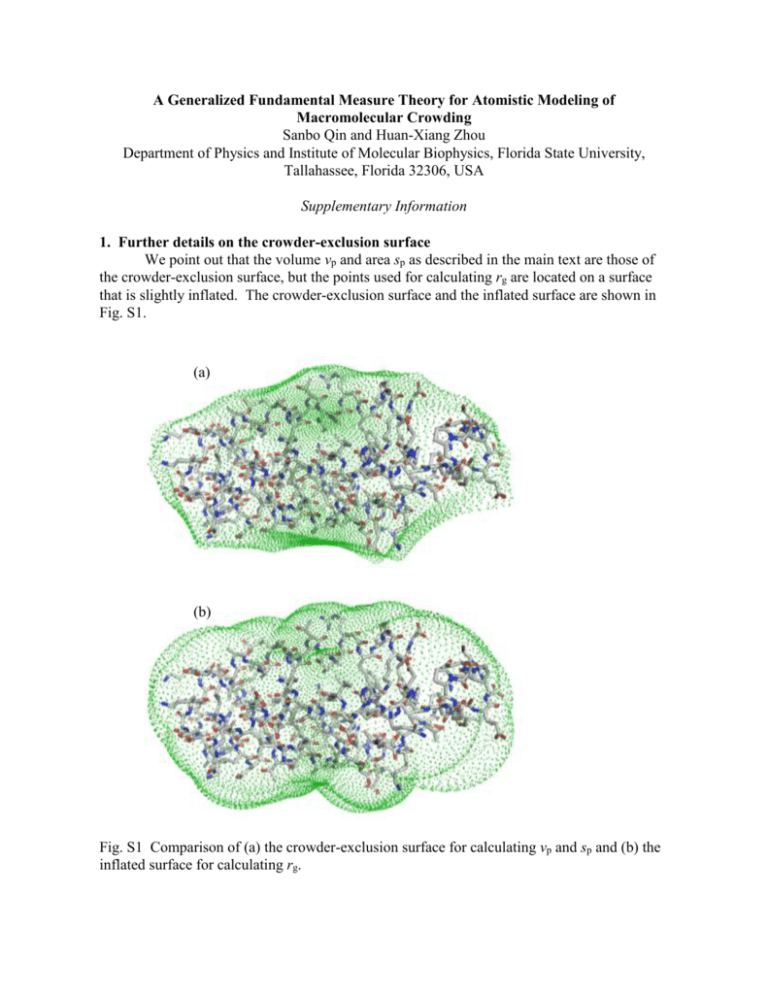
A Generalized Fundamental Measure Theory for Atomistic Modeling of Macromolecular Crowding Sanbo Qin and Huan-Xiang Zhou Department of Physics and Institute of Molecular Biophysics, Florida State University, Tallahassee, Florida 32306, USA Supplementary Information 1. Further details on the crowder-exclusion surface We point out that the volume vp and area sp as described in the main text are those of the crowder-exclusion surface, but the points used for calculating rg are located on a surface that is slightly inflated. The crowder-exclusion surface and the inflated surface are shown in Fig. S1. (a) (b) Fig. S1 Comparison of (a) the crowder-exclusion surface for calculating vp and sp and (b) the inflated surface for calculating rg. The difference between the two surfaces can be illustrated by a simple test particle: a spherocylinder (see Fig. S2). For this convex particle, the crowder-exclusion surface is identical to the surface of the particle. The inflated surface for calculating rg consists of the proximal intersection points between rays emanating from the center of the test particle and crowders around the test particle; the crowders are all in contact with the test particles and the rays end at the center positions of the crowders. Note that, when the crowder radius (denoted as Rc hereafter) is zero, the inflated surface coincides with the crowder-exclusion surface. Fig. S2 The inflated surface (in blue) illustrated on a spherocylindrical test particle (in red). A crowder in contact with the test particle is shown as a circle in dash. The arrow shows a ray pointing from the center of the test particle to the center of the crowder. A black dot indicates the proximal intersection of the ray and the crowder; the collection of such intersection points as the crowder rolls around the test particle defines the inflated surface. Let the spherocylinder, with radius Rsc, be oriented such that its center is at the origin and its central axis be along the z axis of a Cartesian coordinate system. For a crowder located at (xc, 0, zc), the proximal intersection is located at (xi, 0, zi), where R xi xc 1 2 c 2 1/ 2 ( xc zc ) (1a) R (1b) zi zc 1 2 c 2 1/ 2 ( xc zc ) A crowder in contact with the cylindrical portion of the test particle has xc = Rsc + Rc and –Lsc < zc < Lsc, where Lsc the half length of the cylindrical portion. A crowder in contact with the upper hemisphere of the test particle has xc = (Rsc + Rc)sin and zc = (Rsc + Rc)cos + Lsc, where 0 < < /2. For a test protein represented at the atomic level, we found that rg calculated on the inflated surface is ~10% higher than rg calculated on the crowder-exclusion surface. We also found that the higher rg leads to better agreement with the results obtained by the insertion procedure, explaining why we use the inflated surface for rg. Note that both the crowderexclusion surface and the inflated surface depend on the crowder radius. 2 2. Comparison of lp and rg for a spherocylindrical test protein According to the fundament measure theory [1], the linear size lp of a spherocylindrical test protein is lp Rsc Lsc / 2. (2) The radius of gyration can be calculated from r ds , ds 2 rg 2 i (3) where ri ( xi2 zi2 )1/ 2 is the distance from the center of the spherocylinder to a point on the inflated surface; the integration is over the entire inflated surface, and ds is the surface area element. For comparison, we also calculate the integration on the crowder-exclusion surface (which in the present case is the same as the surface of the test particle), and denote the corresponding result by rg0. When Rc = 0, rg reduces to rg0. For rg0, the integration can be calculated analytically. The result is L /R 1 2 2 2 2 2 rg0 sc sc Rsc Lsc / 3 Rsc Lsc Rsc Lsc . (4) Lsc / Rsc 1 Lsc / Rsc 1 We have not been able to calculate the in integration analytically for rg; therefore we calculate rg by numerical integration. When Lsc/Rsc 0, the spherocylinder becomes a sphere, we have rg = rg0 = Rsc, which is the correct result for lp. In the opposite limit Lsc/Rsc , the spherocylinder becomes a long needle; then rg rg0 Lsc/31/2, which slightly overestimates the result of Eq. (2) for this case, lp = Lsc/2. Figure S3 shows that rg is numerically close to lp over a wide range of Lsc/Rsc. 1.E+02 lp/Rsc 1.E+01 rg/Rsc @ Rc/Rsc = 1 1.E+00 1.E-02 1.E-01 1.E+00 rg/Rsc @ Rc/Rsc = 0 1.E+01 1.E+02 L sc/R sc Fig. S3 Comparison of lp and rg for a spherocylindrical test protein. The crowder radius, scaled by Rsc, is either 0 or 1. 3 3. Comparison of methods for calculating sp and vp The sp and vp results obtained by our method are very close to those obtained by a method recently developed by Voss et al. [2]. Figure S4 shows a comparison on the results of the two methods for 8 test systems when the crowder radius is 15 Å. The relative differences in sp are < 0.5%; those in vp are < 1.3%. 9000 (a) (b) 7000 Voss et al. Voss et al. 50000 30000 5000 3000 3000 5000 7000 10000 10000 9000 Our method 30000 50000 Our method Fig. S4 Comparison of (a) sp and (b) vp results between our method and that of Voss et al. Areas and volumes are in Å2 and Å3, respectively. Diagonal lines indicate exact match of the two methods. sp values from small to large correspond to barstar, subunit of E. coli DNA polymerase III (Pol III), barnase, folded cytochrome b562, unfolded cytochrome b562, subunit of Pol III, barnase-barstar complex, and Pol III - complex. The orders between barstar and Pol III and between barnase and folded cytochrome b562 are reversed according to vp values. Averages over protein conformations (see below) are shown, with error bars representing variations among the conformations. Our method is significantly faster than that of Voss et al. The CPU times of our method are independent of the crowder radius, and are ~10 s per conformation for the barnase-barstar complex. In contrast, the CPU times of the method of Voss et al. show a significant increase with increasing crowder radii, going from 54 s at a crowder radius of 15 Å to 1030 s at a crowder radius of 30 Å for each conformation of the barnase-barstar complex. 4. Information on molecular dynamics simulations In all direct simulations of crowding reported to date [3-7], coarse-grained representations of the test protein have been used. We have developed an alternative approach [8-10], referred to as postprocessing. In the postprocessing approach, the motions of the test protein and those of the crowders are followed in two separate simulations. The effects of crowding are then modeled by calculating , the change in the chemical potential of the test protein. The calculation entailed fictitiously placing one by one the protein conformations randomly inside snapshots of the crowder trajectory, much like implementing Widom’s insertion theorem [11]. Like in direct simulations [3-7], the interactions between 4 100 10 -15 the atoms of the test protein and the crowders were assumed to be hard-core repulsion. In that case, is related to the average probability of successfully placing protein conformations into the snapshots of crowder configurations. A successful placement is one that is free of any 1 0 15 30 45 protein-crowder overlap. z (Å) In essence, the generalized fundamental measure theory (GFMT) presented here is a new method for calculating . To directly test this method, we study the same 8 test systems 0.1 (listed in Fig. S4) as those in our previous work developing and applying the postprocessing approach [8, 9], and use the same protein conformations generated in the absence of crowders. The numbers of conformations used were 1000 each for folded and unfolded cytochrome b562; 548 each for barnase, barstar, and their complex; and 700 each for Pol III and subunits and their complex. Briefly, these conformations were sampled from molecular dynamics simulations of proteins solvated by TIP3P, which were run in the AMBER force field. For 7 of the 8 test systems, the simulations were at room temperature. For unfolded cytochrome b562, a high temperature (500 K) was used to denature the protein. Once the conformations are selected, temperature enters the GFMT only together with kB to serve as the unit of [see Eq. (1) of the main text]. [1] S. M. Oversteegen, and R. Roth, J Chem Phys 122, 214502 (2005). [2] N. R. Voss et al., J Mol Biol 360, 893 (2006). [3] M. S. Cheung, D. Klimov, and D. Thirumalai, Proc Natl Acad Sci U S A 102, 4753 (2005). [4] D. D. Minh et al., J Am Chem Soc 128, 6006 (2006). [5] L. Stagg et al., Proc Natl Acad Sci U S A 104, 18976 (2007). [6] D. L. Pincus, and D. Thirumalai, J Phys Chem B 113, 359 (2009). [7] J. Mittal, and R. B. Best, Biophys J 98, 315 (2010). [8] S. Qin, and H.-X. Zhou, Biophys J 97, 12 (2009). [9] J. Batra et al., Biophys J 97, 906 (2009). [10] S. Qin et al., J Phys Chem Lett 1, 107 (2010). [11] B. Widom, J Chem Phys 39, 2802 (1963). 5
