Tema d`Esame di Misure
advertisement
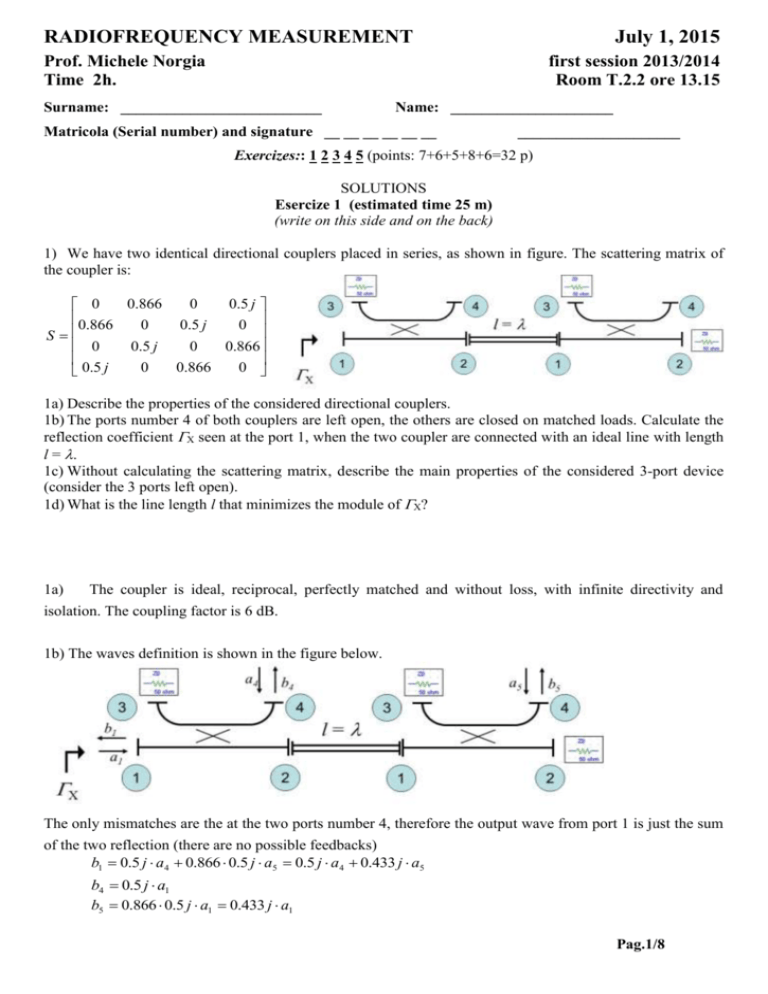
RADIOFREQUENCY MEASUREMENT July 1, 2015 Prof. Michele Norgia Time 2h. first session 2013/2014 Room T.2.2 ore 13.15 Surname: __________________________ Name: _____________________ Matricola (Serial number) and signature __ __ __ __ __ __ _____________________ Exercizes:: 1 2 3 4 5 (points: 7+6+5+8+6=32 p) SOLUTIONS Esercize 1 (estimated time 25 m) (write on this side and on the back) 1) We have two identical directional couplers placed in series, as shown in figure. The scattering matrix of the coupler is: 0.866 0 0.5 j 0 0.866 0 0.5 j 0 S 0 0.5 j 0 0.866 0 0.866 0 0.5 j 1a) Describe the properties of the considered directional couplers. 1b) The ports number 4 of both couplers are left open, the others are closed on matched loads. Calculate the reflection coefficient X seen at the port 1, when the two coupler are connected with an ideal line with length l = . 1c) Without calculating the scattering matrix, describe the main properties of the considered 3-port device (consider the 3 ports left open). 1d) What is the line length l that minimizes the module of X? 1a) The coupler is ideal, reciprocal, perfectly matched and without loss, with infinite directivity and isolation. The coupling factor is 6 dB. 1b) The waves definition is shown in the figure below. The only mismatches are the at the two ports number 4, therefore the output wave from port 1 is just the sum of the two reflection (there are no possible feedbacks) b1 0.5 j a4 0.866 0.5 j a5 0.5 j a4 0.433 j a5 b4 0.5 j a1 b5 0.866 0.5 j a1 0.433 j a1 Pag.1/8 We have considered that the line with length l = does not introduce attenuation nor phase shift. By including the closure equations on open circuits (=1, a4 b4 , a5 b5 ), we get: b1 0.5 j b4 0.433 j b5 0.5 j 0.5 j a1 0.433 j 0.433 j a1 0.437 a1 Therefore: b X 1 0.437 a1 1c) The resulting device is fully matched, reciprocal and with losses. 1d) With a different line length l , we get a transmission coefficient of the line equal to T e j l e j By inserting this transmission coefficient in the equations, we get: b1 0.5 j a 4 T 0.433 j a5 b4 0.5 j a1 b5 T 0.433 j a1 b1 0.5 j 0.5 j a1 T 2 0.433 j 0.433 j a1 (0.25 T 2 0.187) a1 (0.25 e 2 jl 0.187) a1 In order to minimizes the module of X we need 4 2l l 2m (where m is an integer) l m 4 2 Pag.2/8 Esercize 2 (estimated time 25 m) (write on this side and on the back) 2a) Draw and describe the electric scheme of a power-meter made by 8 diodes, placed in differential configuration. 2b) What is the maximum power measurable in the quadratic region of the sensor? 2c) Considering that a single-diode meter has a sensitivity of 500 mV/mW, calculate the sensitivity of the realized power meter. 2d) With a desired bandwidth of 1 MHz, and a noise floor equal to 10 nV/Hz, what is the measured power corresponding to 10 dB of Signal-to Noise Ratio (SNR)? 2e) The meter input is now attenuated by a resistive voltage divider, realized by R1 = 3 kΩ and R2 = 50 Ω. Calculate the new maximum measurable power and the power corresponding to 10 dB of SNR. 2f) Is it possible to realize a power meter with similar performances using a different technology? 2a) The meter is realized as shown in figure. The differential output is proportional to the input RF power, while the meter remains in the quadratic region. Z0 2b) The maximum power for a single diode is about -20 dBm, with the series of 4 diodes it grows up with 20log10(4)=12 dB. Therefore, PMAX= -8 dBm. 2c) The sensitivity is divided by 4, due to the series of 4 diodes, and multiplied by 2 for the differential scheme. In conclusion S = 250 mV/mW 2d) In a first approximation, the noise level is equal to VN=10 nV/Hz B = 10µV It corresponds to an input RF power equal to: V 10 V PN N 40 nW, corresponding to -44 dBm. S 250 V/ W The measured power corresponding to 10 dB of SNR is -34 dBm. 2e) The divider attenuates the input voltage by a factor 1/60, corresponding to -36 dB. The new power range is therefore + 2 dBm (power corresponding to 10 dB of SNR), +28 dBm (end of the quadratic region). 2f) No, even if the power range could be measurable by thermocouple or bolometer sensors, it is impossible for them to reach the required bandwidth (1 MHz). Pag.3/8 Esercize 3 (estimated time 20 m) (write on this side and on the back) 3a) Describe the main properties of the heterodyne conversion, with an example of RF measurement application. 3b) What are the distinctive properties of the direct and indirect frequency synthesis? 3a-b) See the course material. Pag.4/8 Esercize 4 (estimated time 30 m) (write on this side and on the back) 4a) With regards to the vector network analyzer scheme, shown in figure, describe the receivers realization. 4b) Describe qualitatively the measurement errors due to a mismatch of the load indicated by the arrow. R1 R2 A B DUT 4c) If the load were 60 Ω instead of 50 Ω, supposing to measure a DUT with S22=0.5j, please describe the measurement of the S22 module, as a function of the frequency (plot a qualitative trend with frequency, while quoting the amplitude values) 4d) Propose a calibration procedure dedicated to this specific error. 4a) See the course material. 4b) A mismatch in that point changes the signal measured in B, when the signal is applied to the port 2. It generates an error on the measurement of S22variable with frequency, due to the sum in B of the signal reflected by the DUT and the unwanted reflection by the mismatched load. The overall effect on the S22(f) measurement is to have a structure of "holes" periodic in frequency. The mismatch considered does not change the measurements of the other parameters, if the rest of the circuit is matched. 4c) The reflection coefficient s given by: Z Z 0 60 50 1 X L 0.09 Z L Z 0 60 50 11 The wave reflected by the port 2 of the DUT and the one reflected by the mismatched load make both a direct and a cross path in the coupler, then they undergo the same attenuation (6 dB for a 3 dB-coupler). In summary: bB c S22 X e j eg where c is a constant of the system (given by the power divider and the directional coupler), while is a generic term of phase shift between the two reflections (i twill depend on frequency, due to the different paths lengths). The measurement in frequency will follow a behavior as described in figure, with maximum equal to 20 log 10 S11 X -4.6 dB minimum given by 20 log 10 S11 X -7.7 dB (we considered the c parameter was already compensated), instead of -6dB for the ideal measurement (|S22|= 0.5). For this particular case, if the coupler was perfectly symmetric, the error could be theoretically constant with frequency (very difficult in real structure). Pag.5/8 -4.5 -5 -6 S 22 [dB] -5.5 -6.5 -7 -7.5 -8 1 2 3 4 5 6 Frequency [GHz] 7 8 9 10 4d) The calibration procedure should give the correct value of S22: b b S 22 B X e j A( f ) B B( f ) ceg bR We considered that eg is measured by bR. A(f) e B(f) are the two parameter to be determined. A calibration method could be to use two known loads (for example a short circuit and an open circuit), for calculating the two parameters. With everything ideal, in this case it could be possible to use only one calibration load (the matched load), because A(f) could be calculated in theory, but it is preferable to use two loads also in this case. Pag.6/8 Esercize 5 (estimated time 20 m) (write on this side and on the back) 5a) The screen of a spectrum analyzer is shown in figure below. Describe the instrument settings used for this measurement. 5b) Estimate the noise figure and the selectivity of the IF filter. 5c) Let’s suppose that this is a swept measurement: what should be the time needed for drawing the trace? 5d) With modern spectrum analyzer it is possible to speed-up the measurement time? How? 5e) What happens if we set an input attenuation of 20 dB? Draw the new measurement trace directly on the screen in figure. -20 -30 -40 Power [dBm] -50 -60 -70 -80 -90 -100 -110 -120 2000 2000.05 2000.1 2000.15 2000.2 2000.25 2000.3 Frequency [MHz] 2000.35 2000.4 2000.45 2000.5 5a) Settings: fSTART=2000 MHz fSTOP=2000.5 MHz, SPAN=500 kHz. Reference level RL=-20 dBm Ay=10 dB/DIV The two signals have a width at – 3 dB equal to the resolution bandwidth RBW=10 kHz (1/5 of division). 5b) From the noise floor (DANL) we can estimate the analyzer noise figure: PFLOOR=-111 dBm = NFkTRBW= NF-174 dBm/Hz+40 dBHz therefore NF = 23 dB. The filter selectivity, equal to the ration between the width at a -60 dB and the width at -3 dB, is equal to about S=5:1 (at -60 dB the width is about 50 kHz). 5c) For a swept measurement, the time needed is 3SPAN/RBW2 = 15 ms 5d) Yes, by sampling the down-converted signal and making a digital Fourier transform. The time needed becomes equal to 1/RBW + time for elaboration. In this case, it is well below 1 ms. 5e) An input attenuation just induces a rescaling of the trace. In conclusion, we see an increasing of the noise level by a factor 20 dB. Pag.7/8 -20 -30 -40 Power [dBm] -50 -60 -70 -80 -90 -100 -110 -120 2000 2000.05 2000.1 2000.15 2000.2 2000.25 2000.3 2000.35 2000.4 2000.45 2000.5 Frequency [MHz] Pag.8/8
