RPCII
advertisement
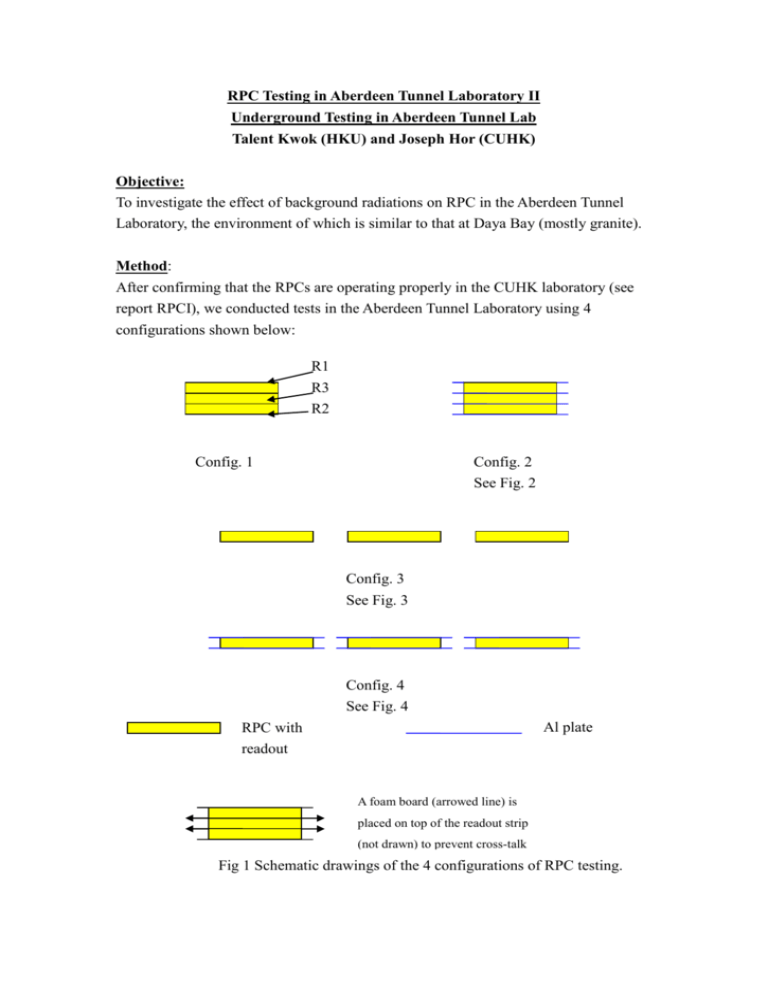
RPC Testing in Aberdeen Tunnel Laboratory II Underground Testing in Aberdeen Tunnel Lab Talent Kwok (HKU) and Joseph Hor (CUHK) Objective: To investigate the effect of background radiations on RPC in the Aberdeen Tunnel Laboratory, the environment of which is similar to that at Daya Bay (mostly granite). Method: After confirming that the RPCs are operating properly in the CUHK laboratory (see report RPCI), we conducted tests in the Aberdeen Tunnel Laboratory using 4 configurations shown below: R1 R3 R2 Config. 1 Config. 2 See Fig. 2 Config. 3 See Fig. 3 Config. 4 See Fig. 4 Al plate RPC with readout A foam board (arrowed line) is placed on top of the readout strip (not drawn) to prevent cross-talk Fig 1 Schematic drawings of the 4 configurations of RPC testing. All three RPCs are placed on the ground with a 5mm thick foam board (Fig. 1) between the readout strips to prevent accidental cross-talk. Each aluminum plate is about 1mm thick and an area of 121x37 cm2. Fig. 2 Photo of Configuration 2, with the 3 RPCs stacked up, each sandwiched by Al plates of 1mm thick. Fig. 3 Photo of Configuration 3, with the 3 RPCs separated (non-stacked), with no Al plates. Fig. 4 Photo of Configuration 4, with the 3 RPCs separated (non-stacked), each sandwiched by Al plates of 1mm thick. Settings: Four data sets were taken, corresponding to the four configurations above (Fig. 1). Each data set consists of 7 data points, representing 3 single count rates, 3 two-fold coincidence count rates and 1 three-fold coincidence count rate. The threshold value for a coincidence was set at 100mV while the time window for coincidence was set to be 100ns. See report RPCI for detailed description of the RPC system. The count rate was taken for 100 seconds in order to minimize statistical error. For each data set, the voltage was varied from 6kV up to 9kV, in steps of 500V. For comparison, the plateau region of the RPC is from 7kV to 9kV (see report RPCI), according to tests at sea level. According to IHEP, the RPCs would be in the avalanche mode if the voltage was set above 10kV. The Aberdeen Tunnel Laboratory has an overburden of 250m rock, with rock composition similar to that in Daya Bay. The muon flux calculated with MUSIC in the lab is about 10-5 cm-2 s-1, or about 2.8 counts for an 30*100cm2 RPC in 100 seconds. Results Fig.s 5-7 show the comparisons of the singles, 2-fold, and 3-fold rates respectively with and without Al plates, with the RPCs being stacked up (Config. 2 and 1). Similary, Fig.s 8-10 show the comparisons for the non-stacked configurations (Config. 4 and 3). At the applied voltage of 8000V, the rates are shown in Table 1. For the stacked configuration, the singles rate is suppressed by about 50% with the presence of Al plates, and the 2-fold rates are suppressed by over 70%, to 1.4 Hz (7.4x10⁻⁴ Hz cm-2). However, the 3-fold rate (0.5 Hz for the active area of 1890 cm2) remains almost unchanged. singles of R1 per 100s shielding effect on singles 140000 120000 100000 80000 60000 40000 20000 0 6000 without Al with Al 7000 8000 9000 voltage(p.d.) V Fig. 5 Comparison of singles rates of R1 with and without Al shielding, (Config. 2 and 1 respectively), with the RPC’s stacked up, as a function of applied voltage across the RPC. 2-fold of R1 and R3 per 100s shielding effect on 2-fold 1500 1000 without Al with Al 500 0 6000 7000 8000 9000 voltage(p.d.) V Fig. 6 Comparison of 2-fold coincidence rates (R1 and R3) with and without Al shielding (Config. 2 and 1 respectively), with the RPC’s stacked up, as a function of applied voltage across RPC. shielding effect on 3-fold 350 3-fold per 100s 300 250 200 without Al 150 100 with Al 50 0 6000 7000 8000 9000 voltage(p.d.) V Fig. 7 Comparison of 3-fold coincidence rates (R1 and R2 and R3) with and without Al shielding (Config. 2 and 1 respectively), with the RPC’s stacked up, as a function of applied voltage across RPC. HV=8000V Singles rate (R1) With Al Stacked up (Config. 1, 2) 45085 No Al With Al 91315 Estimated accidentals Non-stacked (Config. 3, 4) Estimated 53995 2-fold (R1 and R3) 97965 No Al 3-fold (R1/R2/R3) With Al No Al 139 502 54 56 2.88 3.98 0.003 0.004 48 23 0 5 3.52 4.55 0.005 0.005 accidentals Table 1 Comparison of the singles, 2-fold, and 3-fold rates with and without Al plates for stacked up configurations (Config. 2 and 1). All rates are for 100 s. Fig.s 8, 9, 10 show the comparison of the rates for non-stacked configurations (Config. 4 and 3) with and without Al plates. The suppression for the singles rate is about 45%, similar to that in the stacked configuration. There is a clear drop in the 2-fold coincidence rate in this configuration. The 2-fold coincidence rate is about 0.4 Hz (2x10⁻⁴ Hz cm-2) at 8kV. The 3-fold rate drops further, to a few in 100 s. We can estimate the accidental coincidence rates assuming that the background is uncorrelated. The chance coincidence of any 2-fold coincidence count rates is calculated as: Δ2 = 2 x S1 x S2 x 10-7, where S1 and S2 are single count rates of 2 RPC per second, 10-7 is the time window for coincidence (in s), and the factor of 2 refers to 2 time windows. The chance coincidence for 3-fold coincidence is: Δ3 = 3 *xS1 x S2 x S3 x 10-14, where S3 is the single count rate of the third RPC per second. Using these estimates (shown in Table 1), the accidental rates are much lower than the measured coincidence rates, especially for the stacked configurations. We therefore conclude that there are significant correlated events causing the abnormally high 2-fold and 3-fold coincidences. singles of R1 per 100s effect of shielding on singles 140000 120000 100000 80000 60000 40000 20000 0 6000 without Al with Al 7000 8000 9000 voltage(p.d.) V Fig. 8 Comparison of singles rates of R1 with and without Al shielding, (Config. 4 and 3 respectively), with the RPC’s separated horizontally (non-stacked), as a function of applied voltage across the RPC. 2-fold of R1 and R3 per 100s effect of shielding on 2-fold 250 200 150 without Al 100 with Al 50 0 6000 7000 8000 9000 voltage(p.d.) V Fig. 9 Comparison of 2-fold rates (R1 and R3) with and without Al shielding, (Config. 4 and 3 respectively), with the RPC’s separated horizontally (non-stacked), as a function of applied voltage across the RPC. 3-fold per 100s effect of shielding on 3-fold 70 60 50 40 30 20 10 0 6000 without Al with Al 7000 8000 9000 voltage(p.d.) V Fig. 10 Comparison of 3-fold rates (R1 and R2 and R3) with and without Al shielding, (Config. 4 and 3 respectively), with the RPC’s separated horizontally (non-stacked), as a function of applied voltage across the RPC.
