Examination of Electron Transfer Self
advertisement
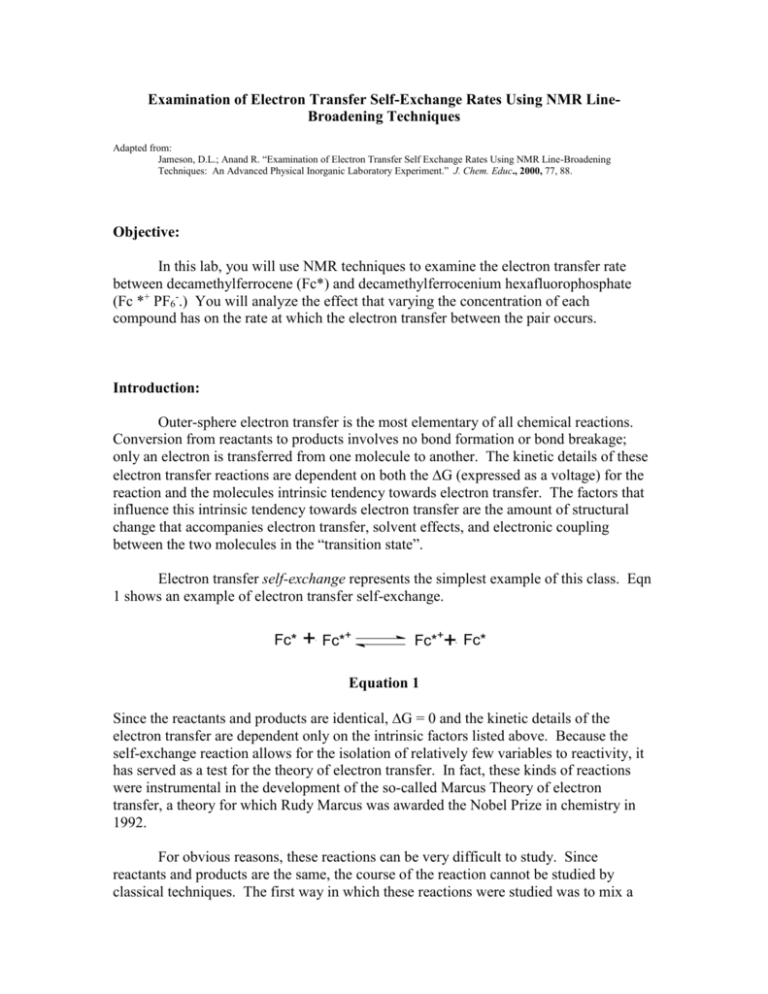
Examination of Electron Transfer Self-Exchange Rates Using NMR LineBroadening Techniques Adapted from: Jameson, D.L.; Anand R. “Examination of Electron Transfer Self Exchange Rates Using NMR Line-Broadening Techniques: An Advanced Physical Inorganic Laboratory Experiment.” J. Chem. Educ., 2000, 77, 88. Objective: In this lab, you will use NMR techniques to examine the electron transfer rate between decamethylferrocene (Fc*) and decamethylferrocenium hexafluorophosphate (Fc *+ PF6-.) You will analyze the effect that varying the concentration of each compound has on the rate at which the electron transfer between the pair occurs. Introduction: Outer-sphere electron transfer is the most elementary of all chemical reactions. Conversion from reactants to products involves no bond formation or bond breakage; only an electron is transferred from one molecule to another. The kinetic details of these electron transfer reactions are dependent on both the G (expressed as a voltage) for the reaction and the molecules intrinsic tendency towards electron transfer. The factors that influence this intrinsic tendency towards electron transfer are the amount of structural change that accompanies electron transfer, solvent effects, and electronic coupling between the two molecules in the “transition state”. Electron transfer self-exchange represents the simplest example of this class. Eqn 1 shows an example of electron transfer self-exchange. Fc* + Fc*+ Fc*++ Fc* Equation 1 Since the reactants and products are identical, G = 0 and the kinetic details of the electron transfer are dependent only on the intrinsic factors listed above. Because the self-exchange reaction allows for the isolation of relatively few variables to reactivity, it has served as a test for the theory of electron transfer. In fact, these kinds of reactions were instrumental in the development of the so-called Marcus Theory of electron transfer, a theory for which Rudy Marcus was awarded the Nobel Prize in chemistry in 1992. For obvious reasons, these reactions can be very difficult to study. Since reactants and products are the same, the course of the reaction cannot be studied by classical techniques. The first way in which these reactions were studied was to mix a radioactive isotope of one oxidation state (Fc* in Eqn. 1) with a nonradioactive isotope of the other oxidation state and measure the rate of distribution of the radioactivity between the two oxidation states as a measure of time. This works well for relatively slow electron exchange (k< 10M-1s-1), but is impractical for very fast exchange reactions. Molecular systems that undergo fast exchange processes (such as electron “exchange” or transfer) can be monitored by NMR (if they contain an NMR detectable nucleus). Kinetic information may be obtained from the NMR spectrum of a rapidly exchanging system by application of the uncertainty principle in Equation 2. = h/(2) Equation 2 The rate constant of a simplified (equally populated “sites”) exchange process may be obtained from a re-expression of the uncertainty principle in Equation 3, 1/2 = kex = /(21/2) Equation 3 where is the energy difference between the two NMR signals expressed in Hz. The ferrocene/ferrocenium couple has been the system most extensively studied by this method. Recent studies on a variety of ferrocene derivatives by Weaver (2), utilizing high field FT NMR instrumentation, provide the basis for this experiment. + + FeII + FeIII FeIII + FeII The electron self-exchange between ferrocene (FC*) and ferrocenium (FC*+) is represented by Eqn. 1, on the previous page. The use of NMR to determine selfexchange rate constants is based on the difference between the proton spectrum of the diamagnetic species, which exhibits very sharp peaks and chemical shifts between 0 and 12 ppm, and the paramagnetic species, which typically displays broad peaks with chemical shifts between –200 and 200 ppm. For electron transfer partners in the “fast exchange” region, mixtures of the two species will display a single coalesced line, with chemical shifts and line-widths that are proportional to mole fraction. The quantity kex is calculated by the re-expression of Equation 3 to take into account unequal mole fractions (or unequal populations of “sites”). kex = 4XdXp()2/ (Wdp-XpWp-XdWd)Ctot Equation 4 where kex is the rate of electron exchange, Xd and Xp are the mole fractions of diamagnetic and paramagnetic species, (=d-p; measured in Hz), Wdp is the peak width at half height of the signal of interest for the mixture, Wd and Wp are the peak widths at half maximum height of the pure diamagnetic and paramagnetic species, and Ctot is the total concentration of the exchanging species in moles/liters. The requirements of the self-exchange/line-broadening experiment limit the choice of electron transfer partners available for investigation. Both partners must contain identical coordination species, the partners must be separated in oxidation state by one electron, and one oxidation state must be paramagnetic and the other must be diamagnetic. Both species must possess sufficient thermodynamic stability to permit NMR spectra to be obtained. In addition, Equation 4 is valid only for those redox partners in the so-called “fast exchange region”, where k(Ctot) >> 2(). Finally, for the sake of experimental convenience, both redox partners should be air stable, so that the NMR samples do not have to be made up in an inert atmosphere. The many substituted derivatives of the ferrocene/ferrocenium couple thoroughly studied by Wahl and Weaver groups are attractive candidates for investigation. It turns out that while virtually all ferrocene derivatives are very stable, many ferrocenium derivatives decompose in the presence of atmospheric oxygen. Decamethylferrocenium (FC*+) is an exception and solutions made on the benchtop and loaded into NMR tubes are stable for several days. This ferrocene derivative is also convenient since analysis of a lone singlet in the NMR (due to the ten equivalent methyl groups) can be used to obtain the parameters needed to solve Equation 4. Note that decamethylferrocene is very expensive and great care must be exercised in carrying out all procedures in this experiment. Experimental Procedures: Note: The accuracy of the data is extremely sensitive to sample preparation. Make up the NMR solutions of decamethylferrocene/decamethylferrocenium mixtures using the utmost care in weighing out samples and measuring solvent volume. The largest source of error in Equation 4 is in the value for Ctot. Synthesis Procedure: To synthesize decamethylferrocenium hexafluorophosphate (Fc* + PF6-), 100 mg of decamethylferrocene (Fc*) is dissolved in 4.0 mL of concentrate sulfuric acid and stirred for six hours. The blue-green solution should then be chilled in ice. Next, 20 mL of ice-cold water is added slowly and the mixture is filtered using a medium frit. A solution of 1.0 g of potassium hexafluorophosphate in 200 mL of water is added to the filtrate, resulting in immediate precipitation of a blue-green powder. The blue-green precipitate is collected by filtration with a medium frit, washed with water and diethyl ether, and allowed to dry. The reaction should yield about 100 mg of product. Fifteen millimolar (mM) solutions of the Fc* + product and the Fc* starting material are prepared using acetone-d6 and 5.0 mL volumetric flasks. A sonicator may be used to help dissolve the samples completely. The resulting Fc* + solution is green in color, and the Fc* solution is yellow. NMR Procedure: The NMR should be freshly gradient-shimmed each time a new sample is analyzed and as many NMR spectra as possible should be obtained in a single day. Keep in mind that the data in these experiments are expressed in units of Hertz (Hz) rather than ppm. The objective of this portion of the experiment is to obtain the values needed for kex in Eqn 4. 1. The following parameters should be used while analyzing the samples: Parameter X-offset X-sweep X-points Scans Relaxation delay New Value -5 [kHz] 25 [kHz] 65536 1000 10 [ms] 2. All of the following samples should have a total volume of 1.0mL and the two 100% samples should be analyzed first: a. 0% Fc*+ / 100% Fc* b. 100% Fc*+ / 0 % Fc* c. 20% Fc*+ / 80% Fc* d. 30% Fc*+ / 70% Fc* e. 50% Fc*+ / 50% Fc* f. 70% Fc*+ / 30% Fc* g. 80% Fc*+ / 20% Fc* Complete the following table: Sample Fc* (100%) Fc*+(100%) Wd or Wp d or p A B C Key: A: Wd and Wp are the peak widths at half maximum height of the pure diamagnetic and paramagnetic species respectively B: d and p are the resonant frequencies (at the max height) of the singlet representing the pure diamagnetic and paramagnetic species respectively C: =d-p and is the chemical shift difference between diamagnetic and paramagnetic species Complete the following table using the Windows Delta software: Ctot (mM) A dp (Hz) B Wdp (Hz) C Xd D Xp E kex (M-1s-1) F Key: A: Ctot is the total concentration of the solutions, and is calculated from the masses of Fc* and Fc*+ and the volume of acetone-d6. B: dp is the resonant frequency (the max height) of the singlet representing the electron transfer pair. C: Wdp is the peak width at half-height of the singlet. D: Xd is the mole fraction of Fc*, calculated from the chemical shift equation, X d=dp-p/. E: Xp is the mole fraction of Fc*+, calculated from the chemical shift equation, Xp=dp-d/. F: kex is the rate constant and kex = 4XdXp()2/ (Wdp-XpWp-XdWd)Ctot
