RAS BALANCE
advertisement
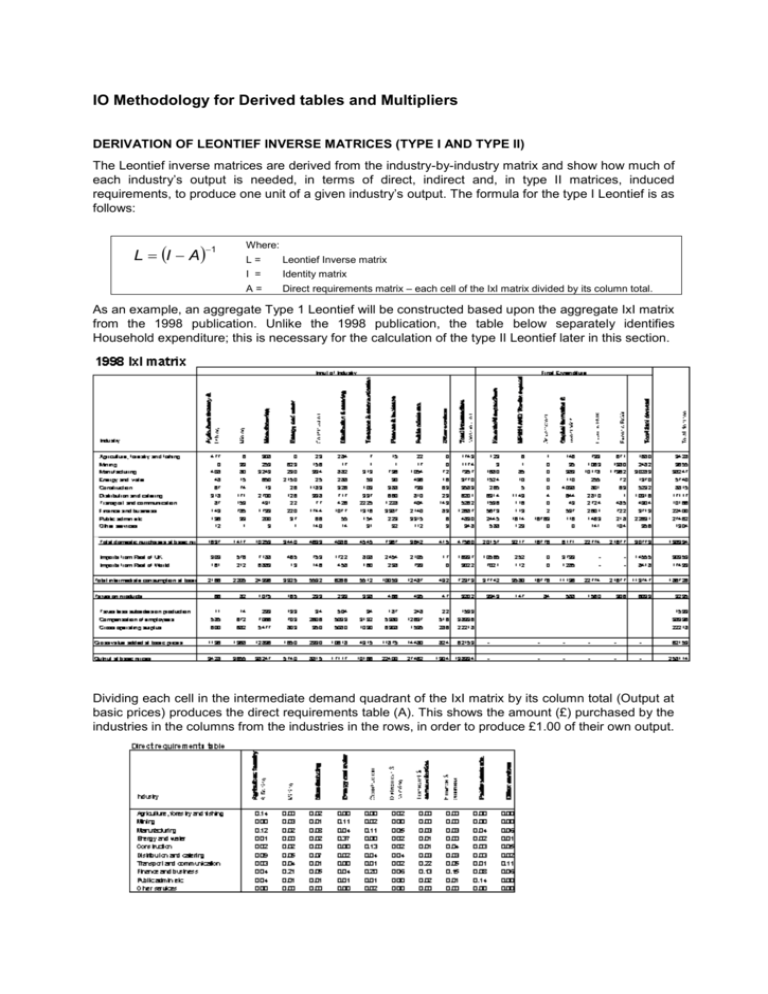
IO Methodology for Derived tables and Multipliers DERIVATION OF LEONTIEF INVERSE MATRICES (TYPE I AND TYPE II) The Leontief inverse matrices are derived from the industry-by-industry matrix and show how much of each industry’s output is needed, in terms of direct, indirect and, in type II matrices, induced requirements, to produce one unit of a given industry’s output. The formula for the type I Leontief is as follows: L I A 1 Where: L= Leontief Inverse matrix I = Identity matrix A= Direct requirements matrix – each cell of the IxI matrix divided by its column total. As an example, an aggregate Type 1 Leontief will be constructed based upon the aggregate IxI matrix from the 1998 publication. Unlike the 1998 publication, the table below separately identifies Household expenditure; this is necessary for the calculation of the type II Leontief later in this section. Dividing each cell in the intermediate demand quadrant of the IxI matrix by its column total (Output at basic prices) produces the direct requirements table (A). This shows the amount (£) purchased by the industries in the columns from the industries in the rows, in order to produce £1.00 of their own output. Constructing an identity matrix of the same dimensions as the direct requirements table (in this case, 10x10) and subtracting the A-matrix from the identity matrix produces the ‘I-A’ matrix, the inverse of which is the type I Leontief Inverse matrix below. The type II Leontief is calculated in the same way as the type I above but, as its purpose is also the estimate the flows of money in and out of households and the effect of these transactions upon industries, it is necessary to ‘endogenise the household sector’. Put simply, we treat households as an additional industry by adding an extra row and column into the direct requirements table for ‘compensation of employees’ and ‘household expenditure’ coefficients respectively. The formal notation for this direct requirements table is: AII A= AHI AIH AHH Where: (AII)ij = amount of industry i required per unit of industry j; (This is identical to the 10x10 Amatrix used in the calculation of the Type I leontief above) (AIH)i = amount of industry i required per unit of total household income from all sources (see note below); (AHI)j = income paid to households per unit of output of industry i; (AHH) = household expenditure per unit of exogenous household income. (This cell is set to zero) Total household income from all sources is used as the denominator when calculating household expenditure coefficients (Aih) even though it may at first seem odd not to use the total household expenditure figure from the IO tables (£37742m + £3349m = £41091m). However, there is a good reason for this:- the total figure of household expenditure from the IO tables includes household purchases that are bought with unearned income (pensions, dividends, etc). In other words, not all household expenditure results from ‘Income from employment’ paid to households. If the £41,091m figure were used as the denominator, the sum of AIH would equal 1 and the resulting type II Leontief would tend to overestimate the induced effects of changes in the Scottish economy by artificially inflating the effect of earned income in generating further rounds of household spending. The Scottish Economic Statistics 2001 publication (table 3.1) gives a figure of total household income from all sources of £68,023m; we use this figure as the denominator when calculating household expenditure coefficients (Aih). This figure is also used to estimate unearned income (68023 – 38396 (total income from employment from IxI) = £29,627m) which is used later in the calibration stage. Once coefficients for the household sector have been included in the manner described above, we arrive at the following direct requirements table ‘A’: Industry Agriculture forestry & fishing Mining Manufacturing Energy and water Construction Distribution & catering Transport & communication Finance & business Public admin etc. Other services Consumers' expenditure Direct requirements table Agriculture, forestry and fishing Mining Manufacturing Energy and water Construction Distribution and catering Transport and communication Finance and business Public admin etc Other services Compensation of employees 0.14 0.00 0.12 0.01 0.02 0.09 0.03 0.04 0.04 0.00 0.17 0.00 0.03 0.02 0.00 0.02 0.05 0.04 0.21 0.01 0.00 0.18 0.02 0.01 0.08 0.02 0.00 0.07 0.01 0.05 0.01 0.00 0.18 0.00 0.11 0.04 0.37 0.00 0.02 0.00 0.04 0.01 0.00 0.12 0.00 0.02 0.11 0.00 0.13 0.04 0.01 0.20 0.01 0.02 0.30 0.02 0.00 0.05 0.02 0.02 0.04 0.02 0.06 0.00 0.00 0.29 0.00 0.00 0.03 0.01 0.01 0.03 0.22 0.13 0.02 0.00 0.31 0.00 0.00 0.03 0.00 0.04 0.03 0.05 0.15 0.01 0.00 0.24 0.00 0.00 0.04 0.02 0.03 0.03 0.01 0.08 0.14 0.00 0.46 0.00 0.00 0.06 0.01 0.05 0.02 0.11 0.06 0.00 0.00 0.40 0.00 0.00 0.02 0.02 0.00 0.09 0.02 0.08 0.04 0.01 0.00 Subtracting matrix A from an identity matrix of the same dimensions (11x11) and calculating the inverse of the result (L = (I-A)-1) yields the type II Leontief inverse: Industry Agriculture forestry & fishing Mining Manufacturing Energy and water Construction Distribution & catering Transport & communication Finance & business Public admin etc. Other services Consumers' expenditure Type II leontief Inverse Agriculture, forestry and fishing Mining Manufacturing Energy and water Construction Distribution and catering Transport and communication Finance and business Public admin etc Other services Compensation of employees 1.17 0.01 0.19 0.06 0.04 0.18 0.07 0.16 0.08 0.01 0.41 0.01 1.03 0.07 0.03 0.05 0.11 0.10 0.34 0.03 0.01 0.39 0.03 0.01 1.12 0.05 0.01 0.13 0.04 0.12 0.03 0.00 0.32 0.01 0.18 0.11 1.62 0.03 0.10 0.05 0.19 0.03 0.00 0.37 0.01 0.03 0.18 0.04 1.18 0.14 0.07 0.38 0.04 0.03 0.58 0.03 0.01 0.09 0.05 0.04 1.11 0.06 0.16 0.03 0.01 0.44 0.01 0.01 0.09 0.04 0.04 0.12 1.33 0.29 0.05 0.01 0.59 0.01 0.01 0.08 0.03 0.07 0.10 0.11 1.27 0.04 0.01 0.43 0.01 0.01 0.10 0.07 0.06 0.13 0.07 0.23 1.20 0.01 0.72 0.01 0.01 0.11 0.05 0.08 0.10 0.19 0.20 0.04 1.01 0.61 0.01 0.01 0.05 0.05 0.02 0.13 0.05 0.15 0.05 0.01 1.14 The type I Leontief has traditionally been multiplied by 1000 for presentation purposes, this approach has been adopted for both Leontief inverse matrices published in 1998. DERIVATION OF MULTIPLIERS AND EFFECTS The 1998 Input-Output publication gives five different type of aggregate multiplier for both type I and type II effects. The multipliers allow users to make estimates of the effects of change in the Scottish economy. Output multiplier (OMULT)j = i Lij The Type I output multiplier for a particular industry is defined to be the total of all outputs from each domestic industry required in order to produce one additional unit of output: that is, the column sums (i ) from the Type I Leontief inverse matrix (Lij). Similarly, the Type II output multiplier is given from the column sums of Industry rows (i.e. exclude compensation of employees) from the Type II Leontief. Income multiplier (IMULT)j = i viLij / vj The Type I and II income multipliers show the increase in income from employment (IfE) throughout the Scottish economy that results from a change of £1 of income from employment in each industry. In the formula above, ‘v’ refers to the ratio of IfE/total output for each industry. (Ieff)j = i viLij Income effects This statistic calculates the impact upon IfE throughout the Scottish economy arising from a change in final demand for industry j’s output of £1. Employment multiplier (EMULT)j = i wiLij / wj The employment multipliers show the total increases in employment throughout the Scottish economy which result from an increase in final demand which is enough to create one additional FTE (full-time equivalent) employment in that industry. In the formula above, ‘w’ is equal to FTE per £ of total output for each industry. This analysis uses the results of the symmetric table analysis, but additionally requires full-time equivalent employment (FTE) data. This data is required in the format of the number of FTE’s by the 128 industry sectors, and is derived using data from the Annual Business Inquiry (ABI). Note this data covers employees only and therefore does not cover self-employed persons. Care must taken when interpreting multiplier analysis of industries that contain a large number of self-employed persons. (Eeff)j = i wiLij Employment effects The employment effects statistic calculates the impact upon employment throughout the Scottish economy arising from a change in final demand for industry j’s output of £1. CONSISTENCY TESTING THE LEONTIEFS AND MULTIPLIERS The term ‘calibration’ is used to describe the process whereby the Leontief Inverses are checked by calculating the matrix product of the Leontief and the vector of final demands. The outcome of this calculation (if the Leontiefs are correct) is to recreate the base year gross outputs at basic prices. Calibration testing the Leontief inverses Og = L Fd Where Og = Column vector (of size 1xn, where n = number of industries in the Leontief) of gross output at basic prices for each industry. When calibrating the type II matrix, an ‘additional’ cell I(1,n+1) is output that should equal the figure of total household income from all sources (£68,023m) L = Leontief Inverse Matrix Fd = Column vector of final demand by industry. When calibrating the type II Leontief, this vector does not include household expenditure and an additional cell (1,n+1) should be included at the bottom of this vector equalling the figure of unearned income (£29,627m). It should be apparent that, as the type II Leontief is equivalent to the type I Leontief but also includes induced effects, each and every cell in the T2 matrix should be of equal or greater value to its T1 equivalent. An extra check is carried out on the income multipliers. Dividing the type I income multiplier for each industry by the corresponding type II value should lead to a constant ratio across all industries. In 1998, this constant ratio was 0.89.
