1 - People Server at UNCW
advertisement
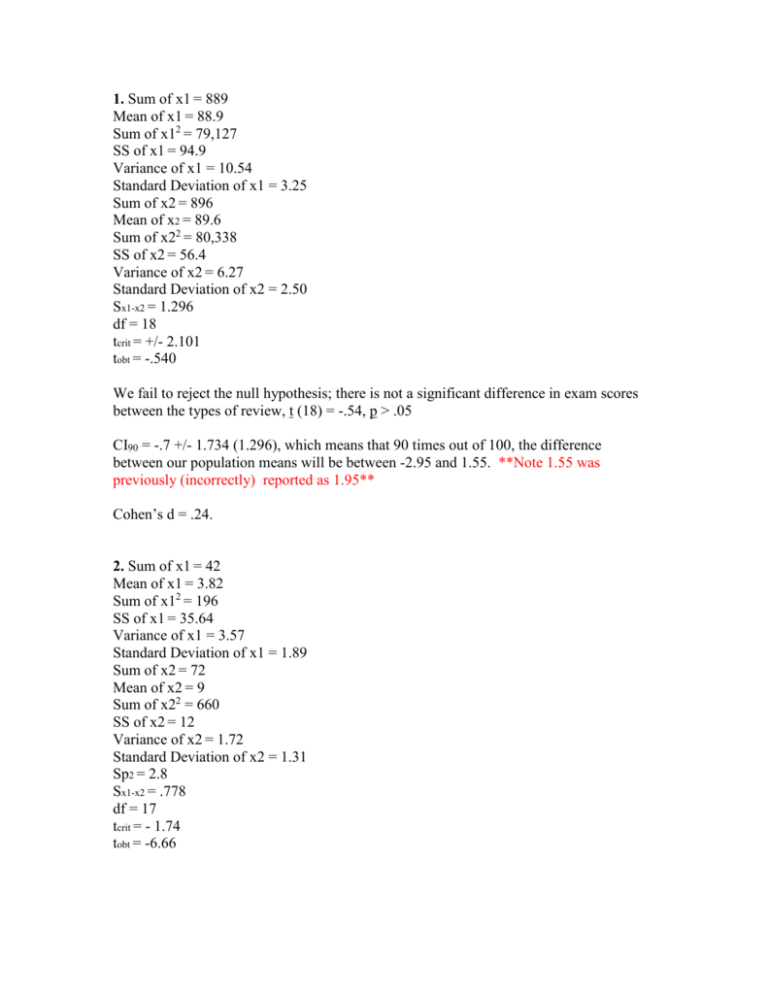
1. Sum of x1 = 889 Mean of x1 = 88.9 Sum of x12 = 79,127 SS of x1 = 94.9 Variance of x1 = 10.54 Standard Deviation of x1 = 3.25 Sum of x2 = 896 Mean of x2 = 89.6 Sum of x22 = 80,338 SS of x2 = 56.4 Variance of x2 = 6.27 Standard Deviation of x2 = 2.50 Sx1-x2 = 1.296 df = 18 tcrit = +/- 2.101 tobt = -.540 We fail to reject the null hypothesis; there is not a significant difference in exam scores between the types of review, t (18) = -.54, p > .05 CI90 = -.7 +/- 1.734 (1.296), which means that 90 times out of 100, the difference between our population means will be between -2.95 and 1.55. **Note 1.55 was previously (incorrectly) reported as 1.95** Cohen’s d = .24. 2. Sum of x1 = 42 Mean of x1 = 3.82 Sum of x12 = 196 SS of x1 = 35.64 Variance of x1 = 3.57 Standard Deviation of x1 = 1.89 Sum of x2 = 72 Mean of x2 = 9 Sum of x22 = 660 SS of x2 = 12 Variance of x2 = 1.72 Standard Deviation of x2 = 1.31 Sp2 = 2.8 Sx1-x2 = .778 df = 17 tcrit = - 1.74 tobt = -6.66 We reject the null hypothesis; the experimental method significantly reduces anxiety, t (17) = -6.66, p <.05. CI95 = -5.18 +/- 2.110 (.778), which means that 95 times out of 100, the difference between our population means will be between -6.82 and -3.54. Cohen’s d = 3.1 **note, this was previously (incorrectly) reported as 1.48 3. Sum of x1 = 97 Mean of x1 = 12.125 Sum of x12 = 1317 SS of x1 = 140.88 Variance of x1 = 20.16 Standard Deviation of x1 = 4.49 Sum of x2 = 116 Mean x2 =14.5 Sum of x22 = 1952 SS of x2 = 270 Variance of x2 = 38.56 Standard Deviation of x2 = 6.21 Sx1-x2 = 2.71 df = 14 tcrit = +/- 2.145 tobt = -.877 We fail to reject the null hypothesis; there is not a significant difference in depression scores between college students who sunbathed and those who did not, t (14) = -.876, p >.05. CI95 = -2.375 +/- 2.145 (2.71), which means that 95 times out of 100, the difference between our population means will be between -8.18 and 3.43. Cohen’s d = .44. 4. Sum of x1 = 89 Mean of x1 = 5.56 SS of x1 = 489.94 Variance of x1 = 32.66 Standard Deviation of x1 = 5.72 Sum of x2 = 58 Mean x2 = 6.44 SS of x2 = 90.22 Variance of x2 = 11.28 Standard Deviation of x2 = 3.36 Sx1-x2 = 2.09 df = 23 tcrit = - 1.714 tobt = -.421 We fail to reject the null hypothesis; children who read scary stories do not have significantly more nightmares than children who read cheerful stories, t (23) = -.421, p > .05. CI95 = -.882 +/- 2.069 (2.09), which means that 95 times out of 100, the difference between our population means will be between -5.21 and 3.45. Cohen’s d = .18.


