Radioactive Decay Problems: Half-Life & Decay Constants
advertisement
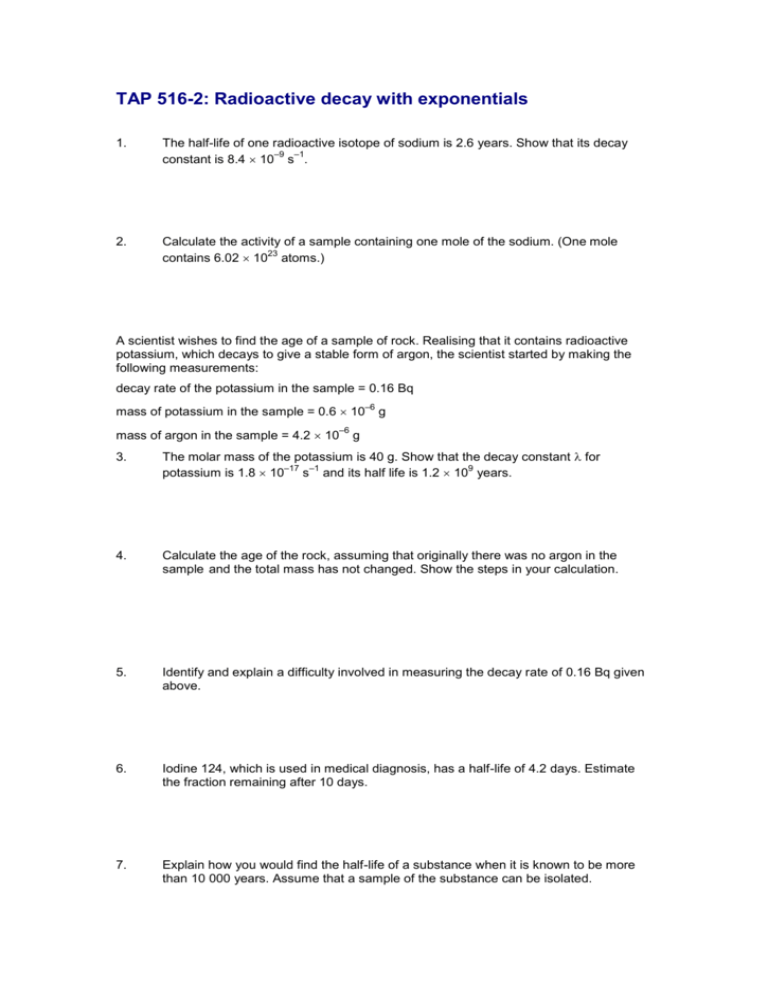
TAP 516-2: Radioactive decay with exponentials 1. The half-life of one radioactive isotope of sodium is 2.6 years. Show that its decay –9 –1 constant is 8.4 10 s . 2. Calculate the activity of a sample containing one mole of the sodium. (One mole 23 contains 6.02 10 atoms.) A scientist wishes to find the age of a sample of rock. Realising that it contains radioactive potassium, which decays to give a stable form of argon, the scientist started by making the following measurements: decay rate of the potassium in the sample = 0.16 Bq –6 mass of potassium in the sample = 0.6 10 –6 mass of argon in the sample = 4.2 10 g g 3. The molar mass of the potassium is 40 g. Show that the decay constant for –17 –1 9 potassium is 1.8 10 s and its half life is 1.2 10 years. 4. Calculate the age of the rock, assuming that originally there was no argon in the sample and the total mass has not changed. Show the steps in your calculation. 5. Identify and explain a difficulty involved in measuring the decay rate of 0.16 Bq given above. 6. Iodine 124, which is used in medical diagnosis, has a half-life of 4.2 days. Estimate the fraction remaining after 10 days. 7. Explain how you would find the half-life of a substance when it is known to be more than 10 000 years. Assume that a sample of the substance can be isolated. In an experiment to find the half-life of zinc-63, a sample containing a sample of the radioactive zinc was placed close to a GM tube and the following readings were recorded. –1 The background count rate was 30 min . Time / hours Counts / min–1 0 259 0.5 158 1.0 101 1.5 76 2.0 56 2.5 49 3.0 37 8. Plot a graph of count rate against time and use this to find the average time for the count rate to fall to one-half of its previous value. 9. Plot a second graph, ln (count rate) against time, and use it to find the half-life. 10. Discuss which method, 8 or 9, provides a more reliable value. Practical advice The questions provide a variety of kinds of practice, at post-16 standard, with radioactive decay, half life and decay constants. Answers and worked solutions 1. ln 2 0.693 8.4 10 9 s –1 7 –1 t 12 2.6 y 3.16 10 s y A dN – N dt 2. (8.4 10 9 s 1 ) (6.02 10 23 ) 5.1 10 15 Bq 3. t1 2 dN / dt N 0.16 Bq [(0.6 10 6 g)/40 g] (6.02 10 23 ) 1.8 10 17 s 1 ln 2 0.693 1.8 10 17 s 1 3.85 1016 s 1.2 109 years 4. 0.6 10 6 g 1 1 so there have been three half-lives. 4.8 10 6 g 8 2 3 3 1.2 109 years 3.6 109 years 5. The background count rate is likely to be higher than 0.16 Bq. 6. There have been 10 days 1 2.38 half-lives. The ratio remaining is 2.38 0.19. 4.2 days 2 7. Place a GM tube near the sample and measure the count rate over a long period of time. Determine a value for dN/dt. Determine N by chemical means, and from that find and T1/2. 8. Subtract the background count rate from all readings. The half-life is about 40 minutes. first sample half life 200 to 100 in 0.6h + second sample half life 160 to 80 in 0.65h 200 third sample half life 120 to 60 in 0.7h + average time = 0.65 h 40 min 0.6 h 100 0.65 h + 0.7 h + + + + 0 0 0.5 1.0 1.5 2.0 t/h 2.5 3.0 9. Corrected count rate / min–1 ln corrected count rate / min–1 229 5.43 128 4.85 71 4.26 46 3.83 26 3.26 19 2.94 7 1.95 5 gradient = – = + t1 = + 4 + 2 + 3 ln 2 ln 2 × 2.0 h = = 0.60 h 2.3 = 36 min + 2.7 – 0.7 = 2.0 h 2 –2.3 2.0 h + 1 0 0 0.5 1.0 1.5 2.0 t/h 2.5 3.0 10. The second method is more reliable. By drawing a straight line of best fit in question 9, all the data are being averaged rather than just the three pairs taken from the curve in question 8. External reference This activity is taken from Advancing Physics chapter 10, 90S
