Density of a Liquid Lab: Graphical Analysis
advertisement
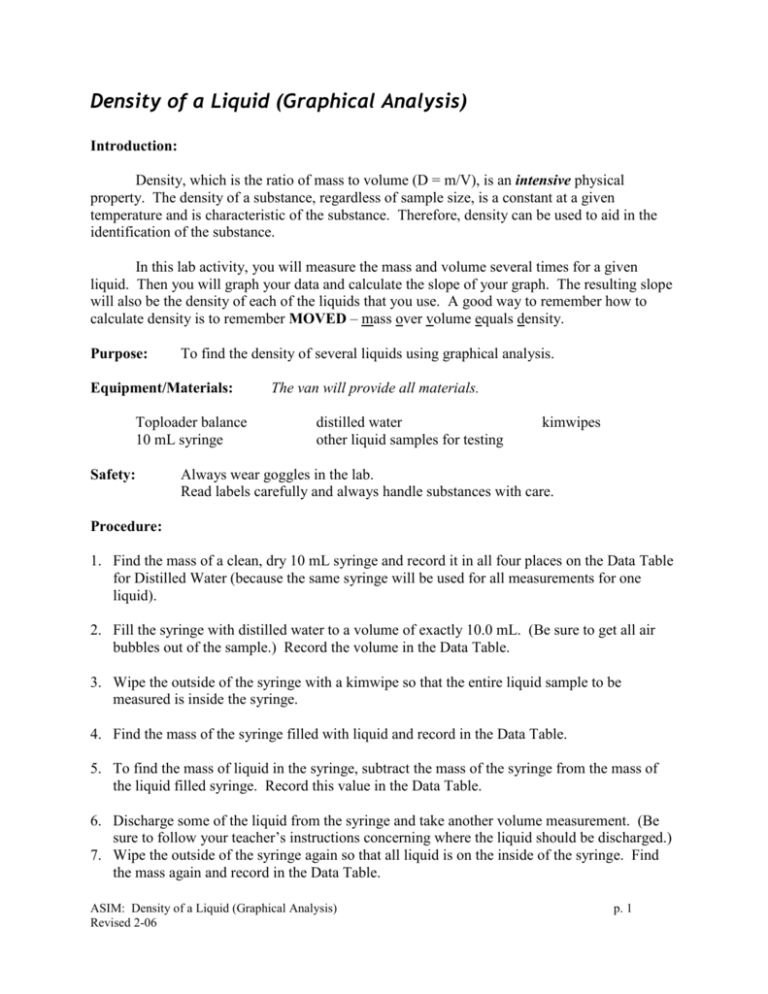
Density of a Liquid (Graphical Analysis) Introduction: Density, which is the ratio of mass to volume (D = m/V), is an intensive physical property. The density of a substance, regardless of sample size, is a constant at a given temperature and is characteristic of the substance. Therefore, density can be used to aid in the identification of the substance. In this lab activity, you will measure the mass and volume several times for a given liquid. Then you will graph your data and calculate the slope of your graph. The resulting slope will also be the density of each of the liquids that you use. A good way to remember how to calculate density is to remember MOVED – mass over volume equals density. Purpose: To find the density of several liquids using graphical analysis. Equipment/Materials: Toploader balance 10 mL syringe Safety: The van will provide all materials. distilled water other liquid samples for testing kimwipes Always wear goggles in the lab. Read labels carefully and always handle substances with care. Procedure: 1. Find the mass of a clean, dry 10 mL syringe and record it in all four places on the Data Table for Distilled Water (because the same syringe will be used for all measurements for one liquid). 2. Fill the syringe with distilled water to a volume of exactly 10.0 mL. (Be sure to get all air bubbles out of the sample.) Record the volume in the Data Table. 3. Wipe the outside of the syringe with a kimwipe so that the entire liquid sample to be measured is inside the syringe. 4. Find the mass of the syringe filled with liquid and record in the Data Table. 5. To find the mass of liquid in the syringe, subtract the mass of the syringe from the mass of the liquid filled syringe. Record this value in the Data Table. 6. Discharge some of the liquid from the syringe and take another volume measurement. (Be sure to follow your teacher’s instructions concerning where the liquid should be discharged.) 7. Wipe the outside of the syringe again so that all liquid is on the inside of the syringe. Find the mass again and record in the Data Table. ASIM: Density of a Liquid (Graphical Analysis) Revised 2-06 p. 1 8. Repeat Steps 6-7 two more times so that you have a total of four (4) data points (mass and volume measurements) for that liquid. 9. After completing the water sample, follow Steps 1-8 for two other liquid samples. 10. Plot the data you have measured as points on a graph. Plot mass on the “y” (vertical) axis and volume on the “x” (horizontal) axis. All three liquids can be graphed on the same sheet of graph paper provided you color-code the graphs in different ways and label the graph accordingly. 11. Use a ruler to draw the best straight line possible through the points on your graph. Calculate the slope of the line using rise/run (y/x). The slope of the graph will be the same as the density value and the units will be the same (grams/mL). 12. Compare your result to the accepted density result for each liquid and calculate the % error for your result using the following formula: % error = accepted value – calculated value x 100 accepted value ASIM: Density of a Liquid (Graphical Analysis) Revised 2-06 p. 2 Density of a Liquid (Graphical Analysis) Data Table Name(s): Date: Period/Lab Group: Data Table for Distilled Water: Mass of Syringe Mass of Syringe + Liquid Mass of Liquid Volume of Liquid Data Table for Liquid A: Mass of Syringe Mass of Syringe + Liquid Mass of Liquid Volume of Liquid Data Table for Liquid B: Mass of Syringe Mass of Syringe + Liquid Mass of Liquid Volume of Liquid ASIM: Density of a Liquid (Graphical Analysis) Revised 2-06 p. 3 Data Table for Calculations: Sample Distilled Water Calculated Slope Accepted Density Value % error Liquid A: Liquid B: Questions: 1. Suppose that your three liquid samples are not miscible (will not mix with each other). If you placed all three into a single container, in what order would they end up (going from top to bottom)? Explain. 2. What advantages are there to graphical determinations of density over calculated density measurements? 3. Explain at least two things that could be responsible for your % error. ASIM: Density of a Liquid (Graphical Analysis) Revised 2-06 p. 4 ASIM: Density of a Liquid (Graphical Analysis) Revised 2-06 p. 5

