Penny Decay Lab Document
advertisement
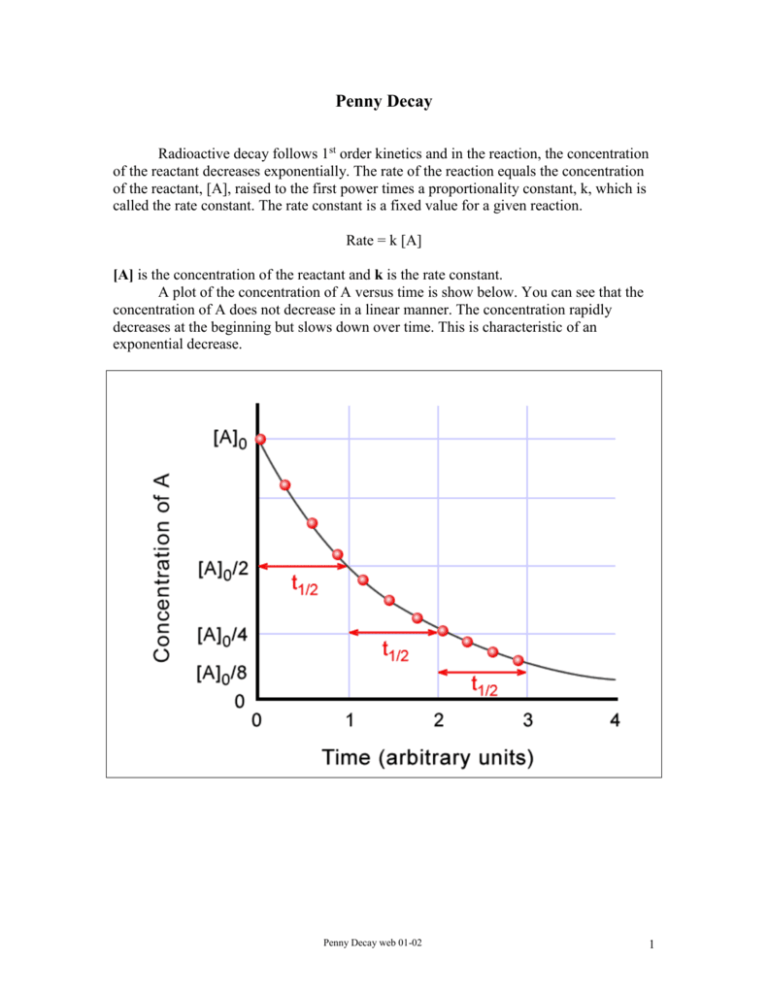
Penny Decay Radioactive decay follows 1st order kinetics and in the reaction, the concentration of the reactant decreases exponentially. The rate of the reaction equals the concentration of the reactant, [A], raised to the first power times a proportionality constant, k, which is called the rate constant. The rate constant is a fixed value for a given reaction. Rate = k [A] [A] is the concentration of the reactant and k is the rate constant. A plot of the concentration of A versus time is show below. You can see that the concentration of A does not decrease in a linear manner. The concentration rapidly decreases at the beginning but slows down over time. This is characteristic of an exponential decrease. Penny Decay web 01-02 1 If you plot the natural logarithm of the concentration of A, ln[A], versus time, you will get a graph which is a straight line with a slope equal to -k. See the graph below. In nuclear decay, the rate is proportional to the number of nuclei present. The number of nuclei to decay in a given period of time is always proportional to the number of nuclei left. Nuclear decay is an independent nucleus-by-nucleus process. The probability that a given nucleus will decay in a certain time is constant and independent of other nuclei and the surroundings. It is a random event and not influenced by factors such as temperature or pressure. In place of the concentration of A you can substitute the number of nuclei present, N. Rate = kN The equation to calculate the number of nuclei left at a given time is N kt ln N 0 N = number of nuclei remaining at time t N0 = original number of nuclei Penny Decay web 01-02 2 (Geiger counter reading in counts/time can be substituted for number of nuclei) k= rate constant t = time The time required for the number of nuclei to decay to half of its original value is a constant (independent of the original number). This value is the half-life (t1/2) and is characteristic of the isotope. t 1/2 0.693 k In this experiment, you will simulate radioactive decay using pennies. You will construct a graph of the number of pennies left after a given amount of time (numbers of shakes) versus time and a graph of the natural logarithm of the number of pennies remaining versus time. You will calculate the rate constant and the half-life for the process. Procedure: 1. Obtain a box with a lid containing about 200 pennies. Count the initial number of pennies in the box. Record this value in the Data Table at shake 0. Put the pennies back in the box. 2. Close the box and shake the box several times to thoroughly mix the pennies. 3. Open the box and carefully remove the pennies that are face-up. Be careful not to turn over any of the pennies. Count the number of face-up pennies. Record this value in the Data Table at shake 1. 4. Subtract the number of pennies removed from the initial number of pennies to give the number of pennies remaining. Record this value in the Data Table at shake 1. 5. Close the box and shake the box several times to thoroughly mix the pennies. 6. Open the box and carefully remove the pennies that are face-up. Be careful not to turn over any of the pennies. Count the number of face-up pennies. Record this value in the Data Table at shake 2. 7. Subtract the number of pennies removed from the number of pennies remaining after shake 1 to give the number of pennies remaining. Record this value in the Data Table at shake 2. Penny Decay web 01-02 3 8. Repeat steps 6 and 7 until you have only about 5-10 pennies left in the box. Always subtract the number of pennies removed from the number of pennies remaining in the previous shake. Record the values in the Data Table each time. Data Analysis: 1. Construct a graph of the number of pennies remaining on the y-axis versus the number of the shake on the x-axis. 2. Construct a graph of the natural logarithm of the number of pennies remaining on the y-axis versus the number of the shake on the x-axis. 3. Determine the slope of the line by performing a least squares fit (linear regression analysis) on the data. The slope of the line is equal to –k. Calculate the value of k, the rate constant, and record the value in the Data Table. 4. Use the value of k to calculate the half-life, t½, for the process. Penny Decay web 01-02 4 Penny Decay NAME:__________________________________________ COURSE:___________ LAB PARTNER:___________________________________ PERIOD:___________ DATA TABLE Attach Graphical Analysis graphs or screen captures from your TI-83 calculator as directed by your teacher. Shake Number 0 1 2 3 4 5 6 7 Number of Pennies Removed 0 Number of Pennies Natural Logarithm of Number of Remaining Pennies Remaining Slope of the linear regression line Intercept of the linear regression line Correlation value (R) the linear regression Rate constant Half-life Calculations: Show your calculation of the rate constant and the half-life. Penny Decay web 01-02 5 Post-lab Questions: 1. Does the half-life of the process make sense based on the process used in the lab? Explain 2. Do the following problems using the your calculator or the Graphical Analysis program. Each should contain a print out of the data table, the necessary graphs of the data with correct units and labels on the axes, the determination of k and t½ for the isotope with correct units, and a decay reaction for the isotope. a. The synthetic radioisotope 98 43Tc decays by beta decay and is one of the isotopes most widely used in medicine. The following data were collected: Counts per minute 180 130 104 77 59 46 24 b. 226 88 Time (min) 0 2.5 5.0 7.5 10.0 12.5 17.5 Ra undergoes alpha decay and the following data were collected: Counts per minute 1000 992 924 452 138 Time (hr) 0 1.0 10.0 100.0 250.0 Penny Decay web 01-02 6


