Experiment no
advertisement

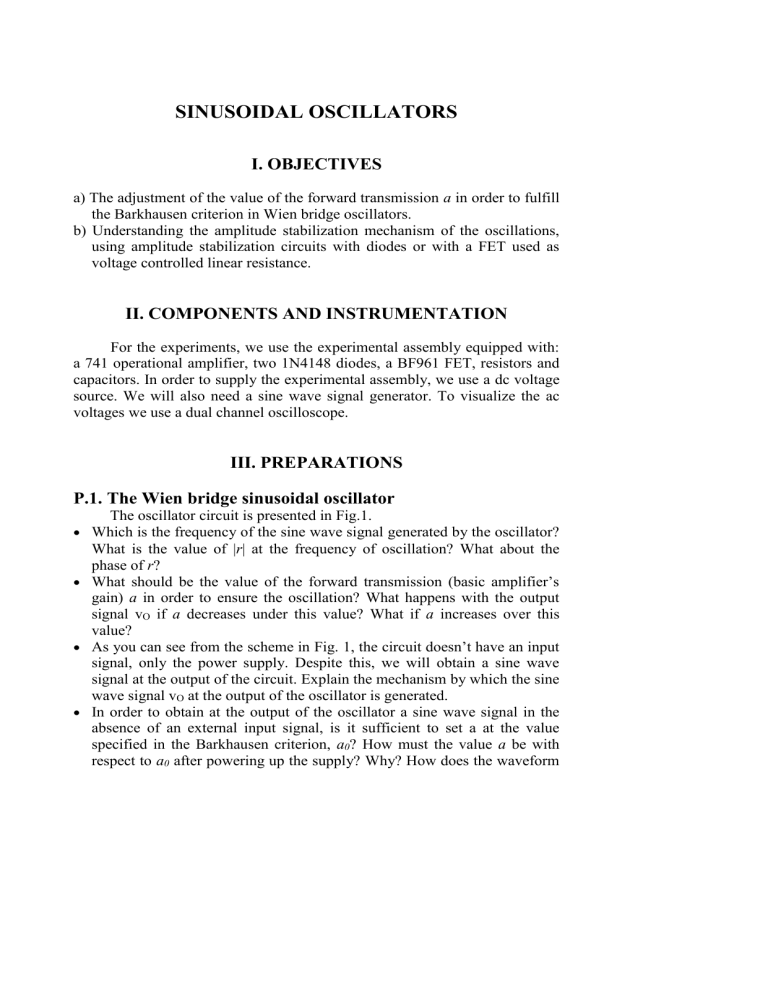
SINUSOIDAL OSCILLATORS I. OBJECTIVES a) The adjustment of the value of the forward transmission a in order to fulfill the Barkhausen criterion in Wien bridge oscillators. b) Understanding the amplitude stabilization mechanism of the oscillations, using amplitude stabilization circuits with diodes or with a FET used as voltage controlled linear resistance. II. COMPONENTS AND INSTRUMENTATION For the experiments, we use the experimental assembly equipped with: a 741 operational amplifier, two 1N4148 diodes, a BF961 FET, resistors and capacitors. In order to supply the experimental assembly, we use a dc voltage source. We will also need a sine wave signal generator. To visualize the ac voltages we use a dual channel oscilloscope. III. PREPARATIONS P.1. The Wien bridge sinusoidal oscillator The oscillator circuit is presented in Fig.1. Which is the frequency of the sine wave signal generated by the oscillator? What is the value of r at the frequency of oscillation? What about the phase of r? What should be the value of the forward transmission (basic amplifier’s gain) a in order to ensure the oscillation? What happens with the output signal vO if a decreases under this value? What if a increases over this value? As you can see from the scheme in Fig. 1, the circuit doesn’t have an input signal, only the power supply. Despite this, we will obtain a sine wave signal at the output of the circuit. Explain the mechanism by which the sine wave signal vO at the output of the oscillator is generated. In order to obtain at the output of the oscillator a sine wave signal in the absence of an external input signal, is it sufficient to set a at the value specified in the Barkhausen criterion, a0? How must the value a be with respect to a0 after powering up the supply? Why? How does the waveform vO(t) look like if a takes this value different from a0? How must the value a be modified after the oscillations have appeared in order to obtain at the output a sine wave signal? The condition for oscillation start-up and then for maintaining the oscillation after start-up implies the achievement of a: ○ Constant and infinite gain in the circuit. ○ Constant and finite gain, given by the Barkhausen criterion. ○ Larger gain than the one from the Barkhausen criterion, at start-up (after power up), followed by the decrease of the gain until it reaches the value from the Barkhausen criterion. P.2. The amplitude stabilization in Wien bridge oscillators On the oscillator with Wien Bridge from Fig.1, we will study now the amplitude stabilization mechanism. In a sinusoidal oscillator with OpAmp there is no input signal, and the sinusoidal oscillation is generated when the circuit is powered up. For the circuit in Fig. 1, plot the waveform of the differential input signal vOUT WIEN(t) after the circuit’s power up. Also plot the output signal, if the basic amplifier’s gain is a>a0, where a0 is the basic amplifier’s gain that fulfils the Barkhausen criterion. Let’s analyze two practical oscillator circuits with OpAmp and Wien Bridge, in which the amplitude stabilization circuit consists of: 1. Diodes 2. FET P.2.1. Amplitude stabilization with diodes The oscillator circuit with OpAmp and Wien Bridge, for which the amplitude stabilization is done using two anti-parallel diodes, is presented in Fig. 2. In what state (on or off) are the diodes D1 and D2 during the transient regime, just after the power up? Compute the gain of the basic amplifier a, in this case. Plot vO(t) and vOUT WIEN(t) in this case. In permanent regime, when we already have at the output a sine wave signal vO(t), are D1 and D2 on? Which is the condition for D1 and D2 to be on? Compute the basic amplifier’s gain a in this case. Why is it necessary the use of two anti-parallel diodes in the circuit from Fig. 2? What is the role of the resistor R5 in parallel with D1 and D2 in the circuit? P.2.2. Amplitude stabilization with FET The Wien Bridge oscillator circuit with OpAmp, for which the amplitude stabilization is done using FET, is presented in Fig. 3. The depletion mode FET is biased as a voltage controlled resistance, rds controlled by vGS, for small signal. What should be the value of the resistance rds of the FET to maintain constant amplitude of the oscillation? Which circuit elements ensure the gate control of the FET in order to obtain a constant rds, at the value computed before? What order of magnitude must the capacitor C3 and the potentiometer POT have? Why? What are the roles of the diode D3 and resistance R7? How would the circuit’s operation change in the absence of the diode D3? What are the advantages and disadvantages of the amplitude stabilization circuit with FET with respect to the one with anti-parallel diodes? IV. EXPLORATIONS AND RESULTS 1. The Wien Bridge sinusoidal oscillator Explorations As experimental assembly you will use the circuit from Fig. 1. Connect J3 with J4,, J9 with J10, and J19 with J20 (i.e. open the PF loop on the output). Supply the assembly with 15V dc between J1 and J2. Apply between terminal IN WIEN and ground a sine wave signal vI(t) from the signal generator, vI(t)=9sin20t [V], where 0=1.6KHz, frequency where the absolute value of the Wien Bridge transfer function is maximum (1/3). Using the oscilloscope visualize the signals vI(t) and vO(t) (between OUT and the ground). Using potentiometer POT from right side, adjust the value of the forward transmission a until the amplitude of the signal vO(t), VO , equals the amplitude of the signal vI(t), VI . Disconnect the sine wave from IN WIEN and close the feedback loop by connecting J7 with J8. Modify the position of the cursor of POT in order to obtain at the output a sine wave signal vO(t), visualizing simultaneously vO(t) and vOUT WIEN(t) on the oscilloscope. Plot the signals vO(t) and vOUT WIEN(t). Measure and write down: - the amplitude and frequency of vO(t); - the amplitude and frequency of vOUT WIEN (t). Results Determine r from the plots of vOUT WIEN (t) and vO(t). Determine the value of the phase shift between vOUT WIEN (t) and vO(t). Using your measurements, check the fulfillment of the Barkhausen criterion. POT R4+R5 10k 2.5K AO + R3 5k R1 10k VO(t) C2 10n R2 10k Voutwien(t) OUT C1 10n GND Fig.1. Wien Bridge sinusoidal oscillator 2. The amplitude stabilization in Wien Bridge oscillators 2.1. Amplitude stabilization with diodes Explorations Use the circuit in Fig. 2 by adding new connections: J11 with J12 and J13 with J14. Supply the circuit with 15V dc. Visualize vO(t) on the oscilloscope. If needed, modify the cursor position of Pot until you obtain a sine wave on the output. Plot vO(t) and measure the amplitude and frequency of vO(t); Visualize and plot vOUT WIEN (t). Measure its amplitude and frequency. Now visualize vO(t) while you decrease the value of Pot, and notice the change in vO(t). Plot vO(t) for a randomly selected position of the cursor of POT, other than the one in the previous exploration step. D1 Pot 2.5K R4 5K R5 5K D2 OUT AO + R3 5k R2 10k R1 10k VO C2 10n C1 10n GND Fig. 2. Wien bridge oscillator: amplitude stabilization with diodes Increase the value of POT and notice the change in vO(t). Redraw vO(t) for a randomly selected value of Pot, other than the ones in the previous exploration steps. Visualize the voltage across the group D1, D2, R5, and -vO(t) with the oscilloscope and plot them. Results Compare the frequency 0 of the signal vO(t) in this Wien Bridge oscillator with amplitude stabilization with the frequency of vO(t) in the basic Wien bridge oscillator measured before. How can you modify vO(t) amplitude, VO at the oscillator output? Give an approximate expression of VO . Is vO(t) a “clean” sine wave (without any distortions)? Why? Find the value of the phase shift between vOUT WIEN (t) and vO(t). How could you determine, using only the plots of vO(t) and vOUT WIEN (t), the value of the forward transmission a of the circuit? Compute it. What process takes place in the circuit if the value of Pot decreases and how does it influence the output vO(t)? Answer the same question if the value of POT increases. 2.2. Amplitude stabilization with FET Explorations You will use the assembly from Fig. 3. To realize this circuit you need to disconnect J3 - J4, J11 - J12, J19 - J20 and J13 - J14 and also you need to connect J15 with J16, J18 with J19 and J20 with J21. Connect J16 with J17 to realize a short circuit between Drain and Ground. Supply the circuit with 15V dc. Visualize on the oscilloscope vO(t) and vOUT WIEN (t) and plot them. Disconnect J16 from J17. Visualize on the oscilloscope vO(t). If needed, adjust Pot from left side until a sine wave is obtained. Plot vO(t). Using the oscilloscope, measure the amplitude and frequency of vO(t). Visualize vOUT WIEN(t) and measure its amplitude and frequency. Visualize on the oscilloscope the voltage between G and ground (GND). Visualize on the oscilloscope vO(t), and decrease the value of Pot. For a randomly selected value of POT, plot again vO(t). Do the same thing increasing the value of Pot. Results What is the value of the forward transmittance a for the circuit in Fig. 3? Is there a significant qualitative difference between the Wien Bridge circuit with diodes and the Wien Bridge circuit with FET? Determine, as in section 2.1, the forward transmittance a of the circuit. Compare it with the value obtained in 2.1. How does the waveform vO(t) modify if Pot increases? What if Pot decreases? Based on the measured VGS, verify the on state of the FET using the databook, and estimate the value of its resistance rds. R7 1K R4+R5+R8 Pot 2.5K 20K D3 AO OUT + Pot 500K C3 330n G VO(t) R3+R6 10K C2 R2 10K 10n VOUTWIEN(t) T R1 10K BF960 C1 10n GND Fig. 3. Wien Bridge oscillator circuit: amplitude stabilization with FET REFERENCES 1. Oltean, G., Circuite Electronice, UT Pres, Cluj-Napoca, 2007, ISBN 978973-662-300-4 2. Sedra, A. S., Smith, K. C., Microelectronic Circuits, Fifth Edition, Oxford University Press, ISBN: 0-19-514252-7, 2004 3. http://www.bel.utcluj.ro/dce/didactic/fec/fec.htm Fig. 4. Experimental assembly


