Correlation Coefficient Worksheet
advertisement
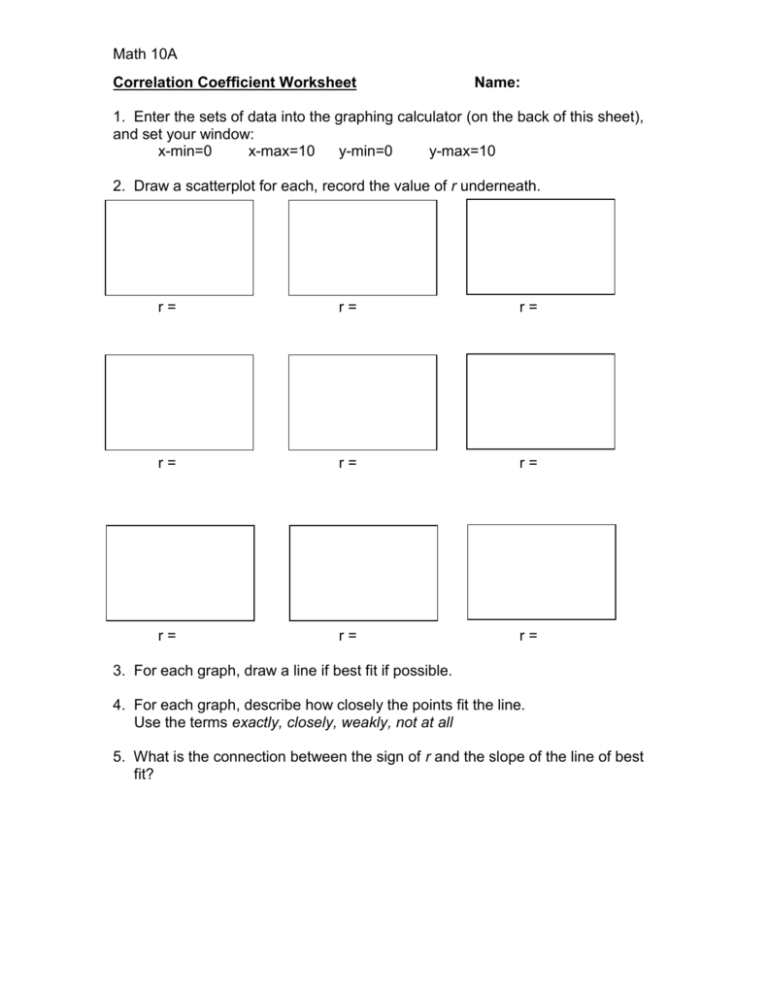
Math 10A Correlation Coefficient Worksheet Name: 1. Enter the sets of data into the graphing calculator (on the back of this sheet), and set your window: x-min=0 x-max=10 y-min=0 y-max=10 2. Draw a scatterplot for each, record the value of r underneath. r= r= r= r= r= r= r= r= r= 3. For each graph, draw a line if best fit if possible. 4. For each graph, describe how closely the points fit the line. Use the terms exactly, closely, weakly, not at all 5. What is the connection between the sign of r and the slope of the line of best fit? Math 10A

