Solutions_Activity_08 - Penn State Department of Statistics
advertisement
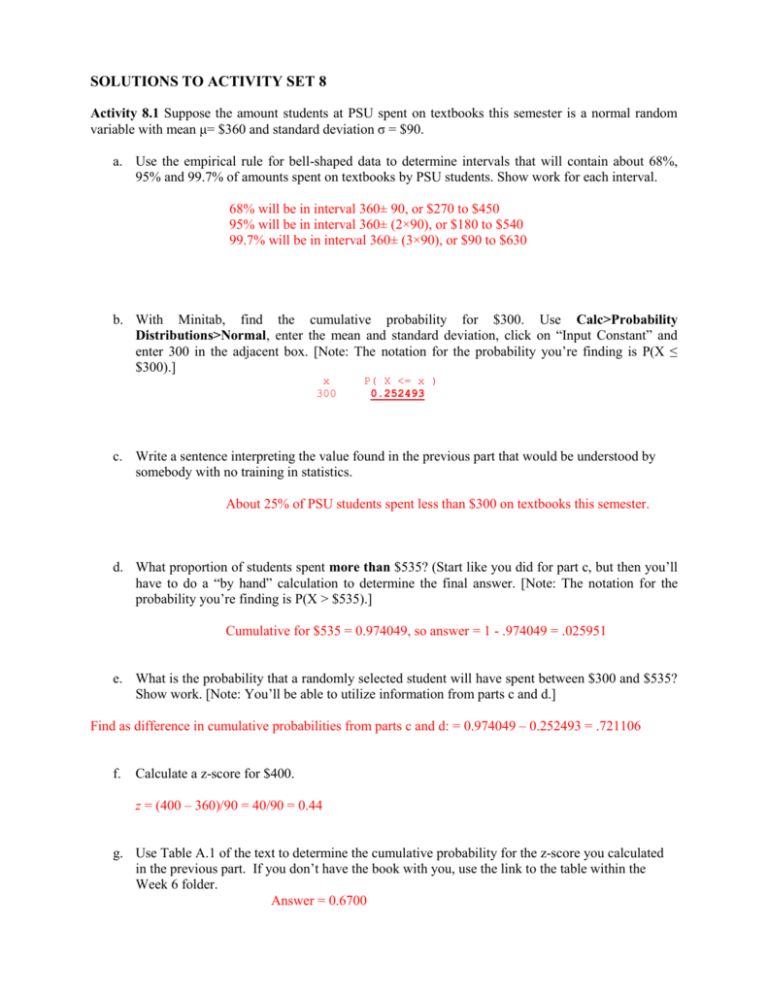
SOLUTIONS TO ACTIVITY SET 8 Activity 8.1 Suppose the amount students at PSU spent on textbooks this semester is a normal random variable with mean μ= $360 and standard deviation σ = $90. a. Use the empirical rule for bell-shaped data to determine intervals that will contain about 68%, 95% and 99.7% of amounts spent on textbooks by PSU students. Show work for each interval. 68% will be in interval 360± 90, or $270 to $450 95% will be in interval 360± (2×90), or $180 to $540 99.7% will be in interval 360± (3×90), or $90 to $630 b. With Minitab, find the cumulative probability for $300. Use Calc>Probability Distributions>Normal, enter the mean and standard deviation, click on “Input Constant” and enter 300 in the adjacent box. [Note: The notation for the probability you’re finding is P(X ≤ $300).] x 300 P( X <= x ) 0.252493 c. Write a sentence interpreting the value found in the previous part that would be understood by somebody with no training in statistics. About 25% of PSU students spent less than $300 on textbooks this semester. d. What proportion of students spent more than $535? (Start like you did for part c, but then you’ll have to do a “by hand” calculation to determine the final answer. [Note: The notation for the probability you’re finding is P(X > $535).] Cumulative for $535 = 0.974049, so answer = 1 - .974049 = .025951 e. What is the probability that a randomly selected student will have spent between $300 and $535? Show work. [Note: You’ll be able to utilize information from parts c and d.] Find as difference in cumulative probabilities from parts c and d: = 0.974049 – 0.252493 = .721106 f. Calculate a z-score for $400. z = (400 – 360)/90 = 40/90 = 0.44 g. Use Table A.1 of the text to determine the cumulative probability for the z-score you calculated in the previous part. If you don’t have the book with you, use the link to the table within the Week 6 folder. Answer = 0.6700 h. Write a sentence interpreting the value found in the previous part that would be understood by somebody with no training in statistics. About 67% of Penn State students spent less than $400 on textbooks. i. Use Minitab to find the probability a randomly selected student spent less than $400. If you didn’t get the same answer as you did in part h, figure out why. The answers should be the same. 0.6716 j. What proportion of students spent more than $400 on textbooks? Show any work. 1−.6716 = .3284 k. Find the probability an amount spent is less than or equal to $240. Solve the problem using Table A1. Show calculation of the z-score as part of your solution. (You can verify your answer using Minitab if you wish.) z = (240 – 360)/90 = –120/90 = –1.33, answer = 0.0918 l. With Minitab, find the 75th percentile of amounts spent on textbooks. Toward the top of the dialog box click “Inverse Cumulative Probability” and in the Input Constant box enter 0.75 (decimal fraction version of 75%). P( X <= x ) 0.75 x 420.704 About $420.70 m. Write a sentence interpreting the value found in the previous part that would be understood by somebody with no training in statistics. About 75% of PSU students spent less than $420.70 (and about 25% spent more). n. In Table A1 search for the cumulative probability most near 0.75. You’re looking “inside” the table where the probabilities are. What is the z-score with this cumulative probability? z = 0.67 Look inside table where the probabilities are; locate 0.7500 (or the closest value to 0.7500), then identify z. o. Refer to the previous part. Determine the amount spent on textbooks having the z-score found in the previous part. Show work. [Note: Compare your answer to the answer found in part m. If the answers differ by a lot, something’s not right.] Using z = (observed – mean), we want to solve for Observed. Std. Dev (0.67)(90) + 360 = $420.30 , which comes from solving 0.67 observed 360 90
