Introduction to power series
advertisement
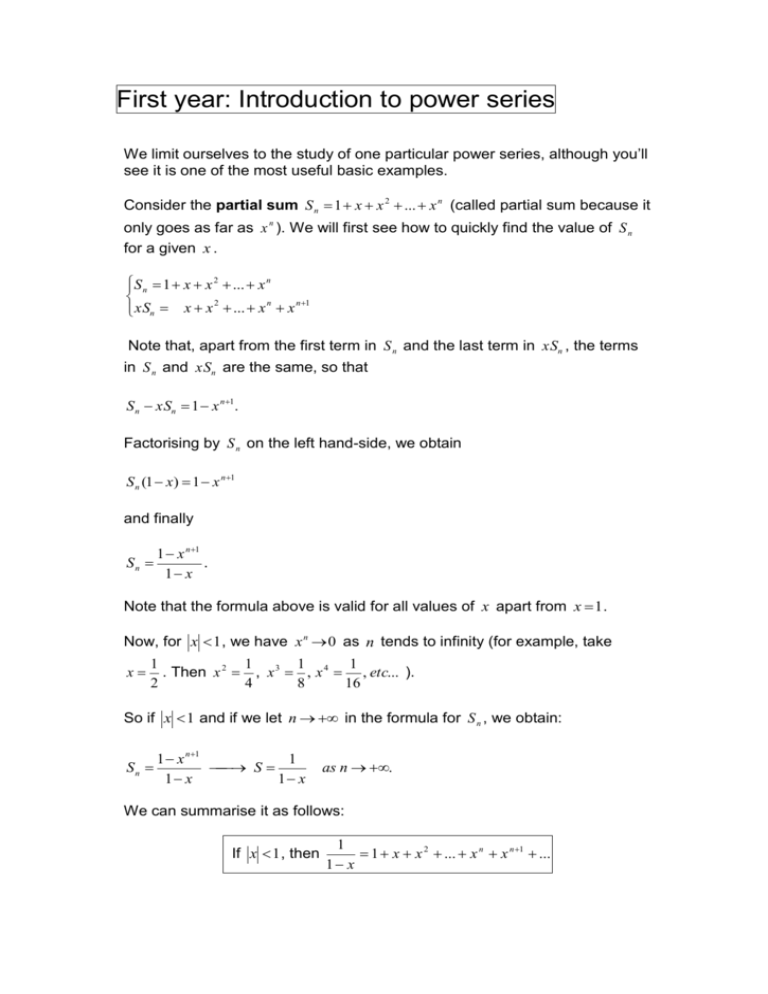
First year: Introduction to power series We limit ourselves to the study of one particular power series, although you’ll see it is one of the most useful basic examples. Consider the partial sum S n 1 x x 2 ... x n (called partial sum because it only goes as far as x n ). We will first see how to quickly find the value of S n for a given x . S n 1 x x 2 ... x n xSn x x 2 ... x n x n1 Note that, apart from the first term in S n and the last term in xSn , the terms in S n and xSn are the same, so that S n xSn 1 x n1 . Factorising by S n on the left hand-side, we obtain S n (1 x) 1 x n1 and finally 1 x n1 Sn . 1 x Note that the formula above is valid for all values of x apart from x 1. Now, for x 1 , we have x n 0 as n tends to infinity (for example, take x 1 1 1 1 . Then x 2 , x 3 , x 4 , etc... ). 2 4 8 16 So if x 1 and if we let n in the formula for S n , we obtain: Sn 1 x n1 1 S 1 x 1 x as n . We can summarise it as follows: If x 1 , then 1 1 x x 2 ... x n x n 1 ... 1 x S 1 x x 2 ... x n x n1 ... is sometimes called the sum of the series (as opposed to the partial sum S n ). The partial sum S n approximates the function f ( x) 1 for x 1 while the 1 x sum of the series S is equal to f (x) for x 1. Let’s see what it means in terms of graphs. Since the partial sums S n 1 approximate the function f ( x) , the larger n is, the better the 1 x approximation should be. On the graphs below, the dots represent S n (for n 2, 5 and 25 respectively) and the line represents the function f (x) itself. Graph of S 2 and f Graph of S 5 and f Graph of S 25 and f The approximation is surprisingly good for n 2 and, for n 25 , there is almost no noticeable difference between S 25 and f on the graph for values of x between 1 and 1 . Now, for values of x bigger than 1 or smaller than 1 , the graph of S n and the graph of f behave differently because the partial sums S n do not approximate the function f any more. Take for example x 2 . Then S n 1 2 2 2 ... 2 n and S n get infinitely large as n tends to . We say that S diverges if x is bigger than 1 or smaller than 1 . For values of x between 1 and 1 we say that S converges. 1 can also be used to obtain series 1 x representing functions that are somehow related to f . For example, it is 1 easy to obtain a series for : 1 x The series derived above for f ( x) f ( x) 1 1 x ... x n 1 x f ( x) 1 1 x x 2 x 3 ... (1) n x n 1 x for 1 x 1. The results and methods given below are given formally, i.e. we give the method but we don’t actually prove it. - We have dx 1 x log( 1 x) . On the other hand dx 1 x (1 x ... x n ...)dx , so that log( 1 x) (1 x ... x n ...)dx . We now assume, without proof, that (1 x ... x Since n x dx n ...)dx 1dx xdx ... x n dx ... for 1 x 1. x n 1 , we obtain n 1 x2 x3 xn log( 1 x) x ... ... 2 3 n for 1 x 1 . Let’s see how the partial sums approximate log( 1 x) . Again, the dots represent the partial sum (in this case up to log( 1 x) : x7 ) and the line represent 7 Notice that the dots and the line “part” when x is smaller than 1 and when x is bigger than 1 . - Instead of integrating 1 , we could also differentiate the function: 1 x d 1 1 . dx 1 x (1 x) 2 Assuming we can differentiate the series for 1 term by term we obtain 1 x 1 1 2 x 3x 2 ... nx n 1 ... 2 (1 x) for 1 x 1. As usual, the dots represent the partial sum (in this case, up to 7x 6 ) and the 1 line represents : (1 x ) 2 Again, from the graph you see that the partial sums approximate 1 only (1 x ) 2 if 1 x 1 . A power series, in general, is a series of the form a k 0 n x n a 0 a1 x a 2 x 2 ... a n x n ... , where the a n are constant numbers and where x is contained in a certain interval.
