Displaying Data with Graphs
advertisement
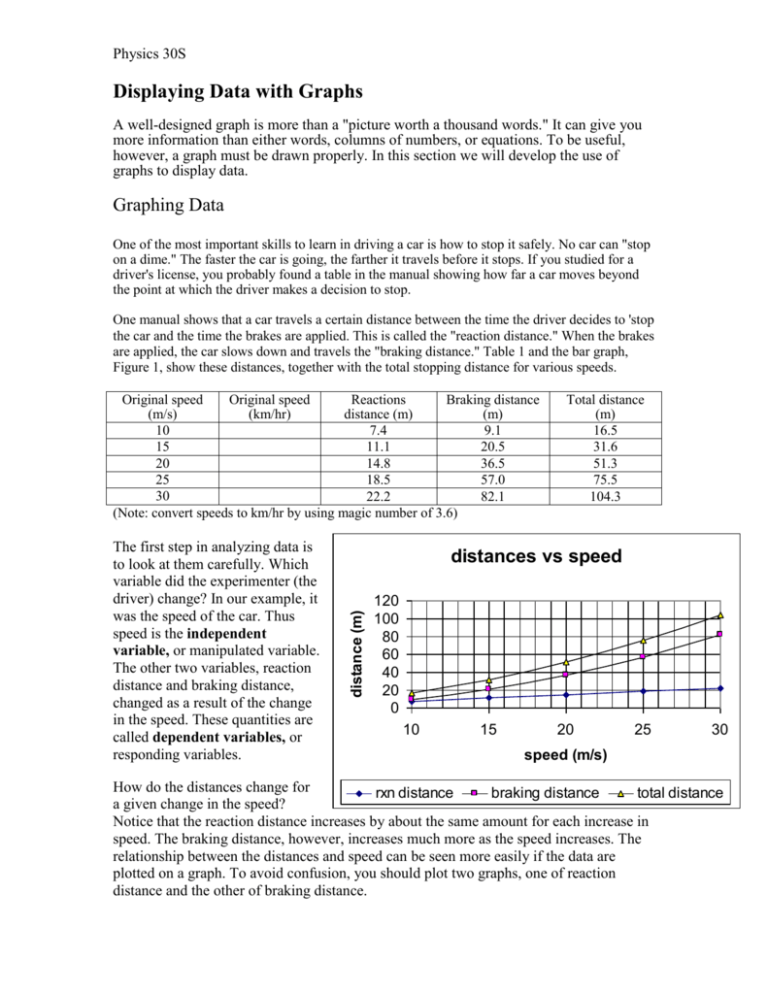
Physics 30S Displaying Data with Graphs A well-designed graph is more than a "picture worth a thousand words." It can give you more information than either words, columns of numbers, or equations. To be useful, however, a graph must be drawn properly. In this section we will develop the use of graphs to display data. Graphing Data One of the most important skills to learn in driving a car is how to stop it safely. No car can "stop on a dime." The faster the car is going, the farther it travels before it stops. If you studied for a driver's license, you probably found a table in the manual showing how far a car moves beyond the point at which the driver makes a decision to stop. One manual shows that a car travels a certain distance between the time the driver decides to 'stop the car and the time the brakes are applied. This is called the "reaction distance." When the brakes are applied, the car slows down and travels the "braking distance." Table 1 and the bar graph, Figure 1, show these distances, together with the total stopping distance for various speeds. Original speed Original speed Reactions Braking distance (m/s) (km/hr) distance (m) (m) 10 7.4 9.1 15 11.1 20.5 20 14.8 36.5 25 18.5 57.0 30 22.2 82.1 (Note: convert speeds to km/hr by using magic number of 3.6) distances vs speed distance (m) The first step in analyzing data is to look at them carefully. Which variable did the experimenter (the driver) change? In our example, it was the speed of the car. Thus speed is the independent variable, or manipulated variable. The other two variables, reaction distance and braking distance, changed as a result of the change in the speed. These quantities are called dependent variables, or responding variables. Total distance (m) 16.5 31.6 51.3 75.5 104.3 120 100 80 60 40 20 0 10 15 20 25 30 speed (m/s) How do the distances change for rxn distance braking distance total distance a given change in the speed? Notice that the reaction distance increases by about the same amount for each increase in speed. The braking distance, however, increases much more as the speed increases. The relationship between the distances and speed can be seen more easily if the data are plotted on a graph. To avoid confusion, you should plot two graphs, one of reaction distance and the other of braking distance. Physics 30S Plotting Graphs These steps will help you plot graphs from data tables. 1. Identify the independent and dependent variables. The independent variable is plotted on the horizontal, or x-axis. The dependent variable is plotted on the vertical, or y-axis. In our example, speed is plotted on the x-axis, and distance is plotted on the y-axis. 2. Determine the range of the independent variable to be plotted. In the example, data are given for speeds between 10 and 30 m/s. A convenient range for the xaxis might be 0-30 m/s. 3. Decide if the origin (0, 0) is a valid data point. When the speed is zero, reaction and stopping distances are obviously both zero. In this case then, your graph should include the origin. Spread out the data as much as possible. Let each space on the graph paper stand for a convenient unit. Choose 2, 5, or 10 spaces to represent 10 m/s. 4. Number and label the horizontal axis. 5. Repeat steps 2-4 for the dependent variable. 6. Plot your data points on the graph. 7. Draw the best straight line or smooth curve that passes through as many data points as possible. Do not use a series of straight-line segments that "connect the dots." 8. Give the graph a title that clearly tells what the graph represents. Linear, Quadratic, and Inverse Relationships Linear Relationship distance (m) Reaction distance vs speed 25 20 15 10 5 0 10 15 20 speed (m/s) 25 30 The graph, Figure 2, of reaction distance versus speed is a straight line. That is, the dependent variable varies linearly with the independent variable; there is a linear relationship between the two variables. The relationship of the two variables shown in this graph can be written as an equation y = mx + b, where m and b are constants called the slope and y-intercept, respectively. Each constant can be found from the graph. The slope, m, is the ratio of the vertical change to the horizontal change. To find the slope, select two points, A and B, as far apart as possible on the line. The vertical change, or rise, y, is the difference in the vertical values of A and B. The horizontal change, x, or run, is the difference in the horizontal values of A and B. The slope of the graph is then calculated as rise y (18.5 7.4)m 11.1m m 0.74s run x (25 10)m / s 15m / s Physics 30S Notice that units have been kept with the variables. The y-intercept b, is the point at which the line crosses the y-axis and is the y value when the value of x is zero. In this case, when x is zero, the value of y is 0 m. For special cases like this, when the y- intercept equals zero, the equation becomes y = mx. The quantity y varies directly with x. y After drawing the graph and obtaining the equation, check to see if the results make sense. The slope indicates the increased Negative Slope reaction distance for an increase in speed. It has units of 15 meters/(meters/second), or seconds. Thus it is a time, the reaction time. It is 10 the time your body takes from the instant the message to stop the car 5 registers in your brain until your foot 0 hits the brake pedal. Thus, the slope is 0 2 4 6 8 a property of the system the graph -5 describes. x The value of y does not always increase with increasing x. If y gets smaller as x gets larger, then y/x is less than zero, and the slope is negative. Quadratic Relationship Braking distance (m) vs speed (m/s) 70 distance 60 50 40 30 20 10 10 15 20 speed 25 30 The graph, Fig. 4, of braking distance vs. speed is not a straight line, but rather looks like a parabola. This indicates that the braking distance varies as the square of the original speed. In other words, if you double your speed, the braking distance increases 4 times. The graph’s slope changes so it cannot be calculated. You can however, calculate the slope of the curve at an instant, by drawing a tangent line. Question: If it takes a person 40 m to stop after driving at 50 km/hr, how far will it take to stop if driving 100 km/hr? 10 Physics 30S Inverse Relationship y vs x Some relationships are such that as one quantity increases, the other decreases. This is called an inverse relationship. Its graph would look like Fig. 5. Again, you may only determine the instantaneous slope by applying the tangent line method. 0.1 0.09 0.08 0.07 0.06 0.05 0.04 0.03 0.02 10 20 30 40 50 Concept Review 1. Suppose a student doing a lab determines that the y – intercept for a graph of reaction time vs. speed was 3.4. What would this mean in ‘real life’? Is it possible? Draw a sketch of what this would look like. 2. In the earlier braking example, at what speed is the reaction distance 10 m? 3. Explain in your own words the significance of a steeper line, or larger slope to the A graph of reaction distance versus speed is made and the slope is found to be 0.74s. Suppose another experiment is made and the slope is found to be steeper. What does this mean? circumference vs. diameter circumference (cm) 4. Critical Thinking- Figure 6 shows the relationship between the circumference and the diameter of a circle. a) Could a different circle’s circumference, be described by a different straight line? b) What is the meaning of the slope? c)What are the units of the slope? 15 10 5 0 1 2 3 diameter (cm) Answers 4 5 Physics 30S Exercises mass (g) vs. volume (cm3) 300 mass (g) 1) The graph shows the mass of three substances for volumes between 0 and 60 cm3. a) What is the mass of 30 cm3 of each substance? b) If you had 100 g of each substance, what would their volumes be? c) What are the units of the slope of the graph? Describe the meaning of the slopes of the lines in this graph. 200 100 0 0 20 40 volume (cm3) 2) During an experiment, a student measured the mass of 10.0 cm3 of ethanol. The student then measured the mass of 20.0 cm3 of ethanol. In this way the data in the table were collected. a) Plot the values given in the table and draw the Volume Mass (g) curve that best fits all points. (cm3) b) Describe the resulting curve. 10 7.9 c) Use the graph to write an equation relating the 20 15.8 volume to the mass of the alcohol. 30 23.7 d) Find the units of the slope of the graph. What is 40 31.6 the name given to this quantity? 50 39.6 60 Physics 30S 3) During a demonstration, an instructor placed a 1.0-kg mass on a horizontal table that was nearly frictionless. The instructor then applied various horizontal forces to the mass and measured the rate at which the mass gained speed (was accelerated) for each force applied. The results of the experiment are shown in the table. a) Plot the values given in the table and draw the curve that best fits all points. b) Describe, in words, the relationship between force and acceleration according to the graph. c) Write the equation relating the force and the acceleration that results from the graph. d) Find the units of the slope of the graph. Force (N) Acceleration (m/s2) 5 4.9 10 9.8 15 15.2 20 20.1 25 25.0 30 29.9

