Sample size - comparing 2 surveys
advertisement
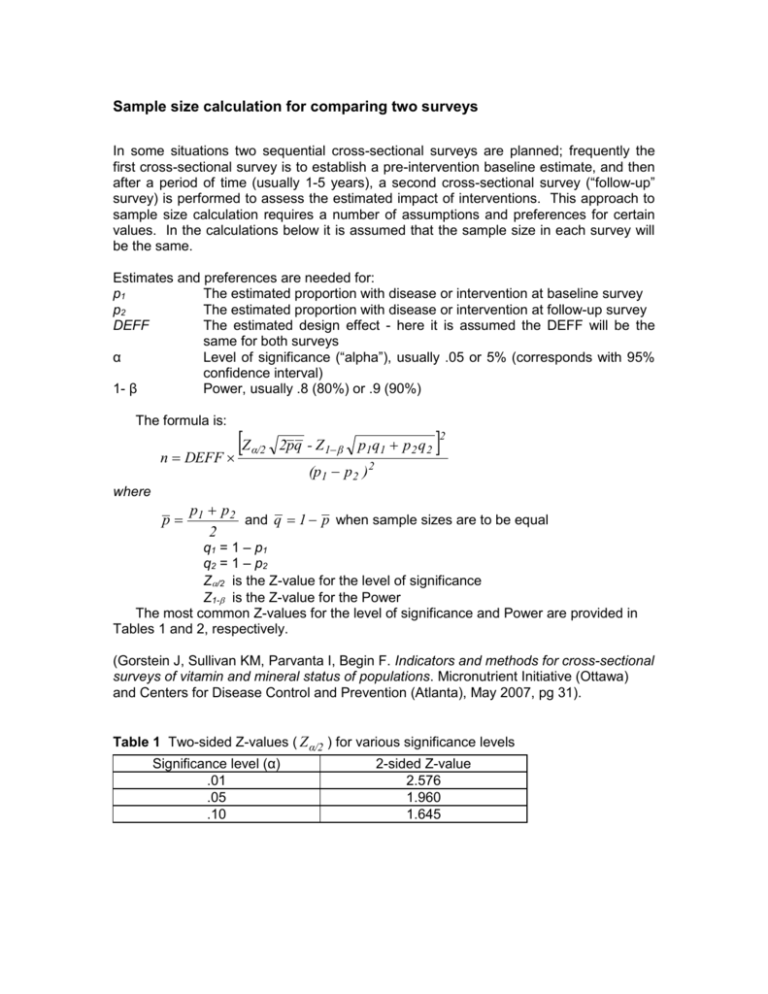
Sample size calculation for comparing two surveys In some situations two sequential cross-sectional surveys are planned; frequently the first cross-sectional survey is to establish a pre-intervention baseline estimate, and then after a period of time (usually 1-5 years), a second cross-sectional survey (“follow-up” survey) is performed to assess the estimated impact of interventions. This approach to sample size calculation requires a number of assumptions and preferences for certain values. In the calculations below it is assumed that the sample size in each survey will be the same. Estimates and preferences are needed for: p1 The estimated proportion with disease or intervention at baseline survey p2 The estimated proportion with disease or intervention at follow-up survey DEFF The estimated design effect - here it is assumed the DEFF will be the same for both surveys α Level of significance (“alpha”), usually .05 or 5% (corresponds with 95% confidence interval) 1- β Power, usually .8 (80%) or .9 (90%) The formula is: Z α/2 n DEFF 2pq - Z 1 β p1q1 p2 q2 2 (p1 p 2 )2 where p p1 p 2 and q 1 p when sample sizes are to be equal 2 q1 = 1 – p1 q2 = 1 – p2 Z/2 is the Z-value for the level of significance Z1- is the Z-value for the Power The most common Z-values for the level of significance and Power are provided in Tables 1 and 2, respectively. (Gorstein J, Sullivan KM, Parvanta I, Begin F. Indicators and methods for cross-sectional surveys of vitamin and mineral status of populations. Micronutrient Initiative (Ottawa) and Centers for Disease Control and Prevention (Atlanta), May 2007, pg 31). Table 1 Two-sided Z-values ( Z α/2 ) for various significance levels Significance level (α) .01 .05 .10 2-sided Z-value 2.576 1.960 1.645 Table 2 One-sided Z-values (Z1-) for various Power (1- β) levels β value Power (1- β) 1-sided Z-value .01 .99 -2.326 .05 .95 -1.645 .10 .90 -1.282 .20 .80 -0.842 Example: A country is going to begin fortifying flour with iron and estimate the baseline prevalence of anemia to be 50% in women of childbearing age. They estimate that iron fortification of flour will lower the prevalence in this group to 40%. Example: p1 = .50, q1 = .50 p2 = .40, q2 = .60 α = .05, therefore Zα/2 = 1.96 β = .20, therefore Z1β = -.842 DEFF = 2 Need to calculate p . For equal sample sizes: p .50 .40 .45 , q 1 .45 .55 2 1.96 n 2 2(.45)(.55 ) - (-.842) (.50)(.50) (.40)(.60) (.50 .40 ) 2 2 2 3.876 776 .01 The sample size would be 776 individuals in for each cross-sectional survey, i.e., 776 for the baseline survey and 776 in the follow-up survey.
