The mean of a trait, z, is simply the sum of values of z in the
advertisement
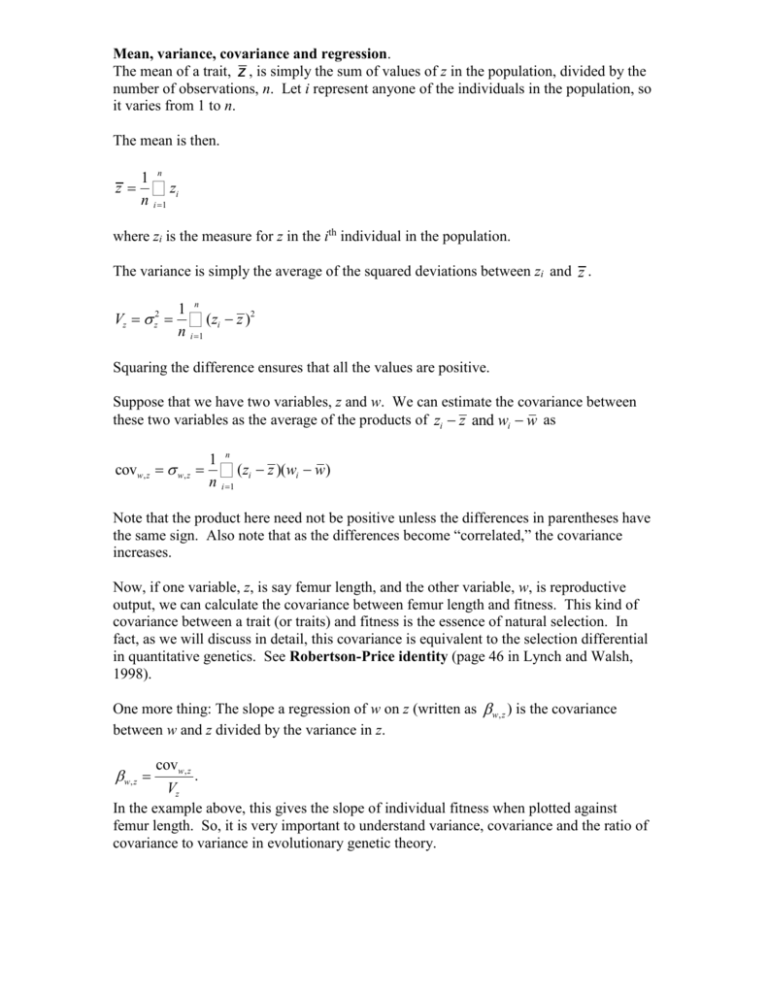
Mean, variance, covariance and regression. The mean of a trait, z , is simply the sum of values of z in the population, divided by the number of observations, n. Let i represent anyone of the individuals in the population, so it varies from 1 to n. The mean is then. z= 1 n å zi n i =1 where zi is the measure for z in the ith individual in the population. The variance is simply the average of the squared deviations between zi and z . Vz = s z2 = 1 n å (zi - z )2 n i =1 Squaring the difference ensures that all the values are positive. Suppose that we have two variables, z and w. We can estimate the covariance between these two variables as the average of the products of zi - z and wi - w as covw,z = s w,z = 1 n å (zi - z )(wi - w) n i =1 Note that the product here need not be positive unless the differences in parentheses have the same sign. Also note that as the differences become “correlated,” the covariance increases. Now, if one variable, z, is say femur length, and the other variable, w, is reproductive output, we can calculate the covariance between femur length and fitness. This kind of covariance between a trait (or traits) and fitness is the essence of natural selection. In fact, as we will discuss in detail, this covariance is equivalent to the selection differential in quantitative genetics. See Robertson-Price identity (page 46 in Lynch and Walsh, 1998). One more thing: The slope a regression of w on z (written as bw,z ) is the covariance between w and z divided by the variance in z. covw,z . Vz In the example above, this gives the slope of individual fitness when plotted against femur length. So, it is very important to understand variance, covariance and the ratio of covariance to variance in evolutionary genetic theory. bw,z =


