Little Chapter_7_HW_..
advertisement
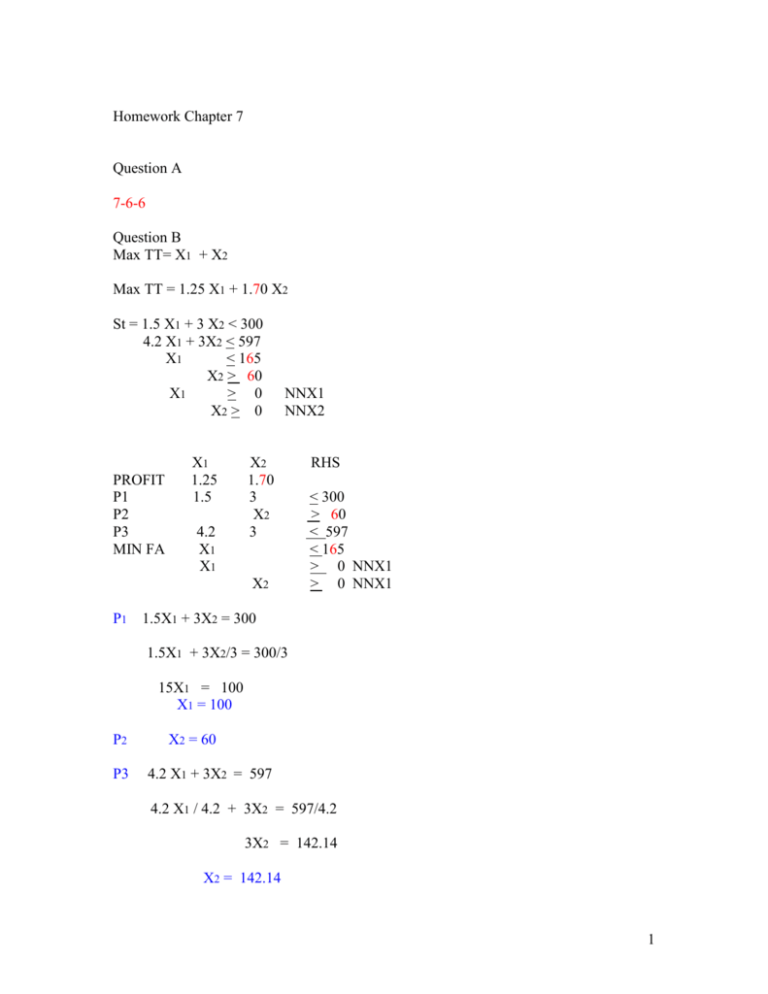
Homework Chapter 7 Question A 7-6-6 Question B Max TT= X1 + X2 Max TT = 1.25 X1 + 1.70 X2 St = 1.5 X1 + 3 X2 < 300 4.2 X1 + 3X2 < 597 X1 < 165 X2 > 60 X1 > 0 X2 > 0 PROFIT P1 P2 P3 MIN FA X1 1.25 1.5 4.2 X1 X1 NNX1 NNX2 X2 1.70 3 X2 3 X2 P1 RHS < 300 > 60 < 597 < 165 > 0 NNX1 > 0 NNX1 1.5X1 + 3X2 = 300 1.5X1 + 3X2/3 = 300/3 15X1 = 100 X1 = 100 P2 P3 X2 = 60 4.2 X1 + 3X2 = 597 4.2 X1 / 4.2 + 3X2 = 597/4.2 3X2 = 142.14 X2 = 142.14 1 4.2 X1 + 3X2 = 597 4.2 X1 + 3X2 / 3 = 597/3 4.2X1 = 199 X1 = 199 ___________________ P1 X1 X2 0 100 200 0 ___________________ P2 X2 = 60 ___________________ P3 X1 X2 0 199 142.14 0 ___________________ Standing orders X1 = 165 = MIN FA NNX1 0 NNX2 0 Max TT : 1.25 X1 + 1.70 X2 SLOPE = C1 = C2 1.25 = 1.2500 = 125 = This goes on the graph… 1.70 = 1.7000 = 170 You can not start to solve for the optimal corner point (solutions for X! & X2) until you have your graph completed. When you do find the optimal corner point on your graph then to solve for the values of X1 & X2 you frist must write down the two Binding consrraints (ie the two equations that Cross at your selected Optimal corner point. Eg. Dough: 1.5X1 + 3X2 = 300 Min X2: X2 -= 60 Then continue to solve for X1 and X2. This is what you were doing below but you made a couple algebra errors. 2 1. When you divide1.5 X1 by 1.5 You must also then divide all terms in the equations by 1.5 ie,. 1.5 X1 / 1.5 + 3X2 / 1.5 = 300 / 1.5 giving: X1 + 2 X2 = 200 Then you can substitute in the Min X2 equation: X2 = 60 and solve for X!. .. 1.5 X1 + 3X2 = 300 1.5 X1/ 1.5 + 3X2 = 300 + 1.5 = 301.5 X1 + 3(60) = 301.5 X1 + 180/180 = 301.5 – 180 X1 = 121.50 New Max TT: 1.25 X1 + 1.70 X2 1.25 (121.50) + 1.70 (60) 151.88 + 102 = TT = 253.88 The above blue answers will be used on the graph….. Question I New TT = 2.50 X1 + 1.70 X2= 2.50 (121.50) + 1.70 (60) = 303.75 + 102 = 405.75 Slope C1/C2 = 250 / 170 No change on the graph….. Question J New TT : 1.25 X1 + 3.00 X2 = 1.25(121.50) + 3.00 (60) = 151.88 + 180 3 Max profit = 331.88 Slope: C1/C2 = 125 / 300 this goes on the graph……. 4


