Statistics and Sampling Distributions
advertisement
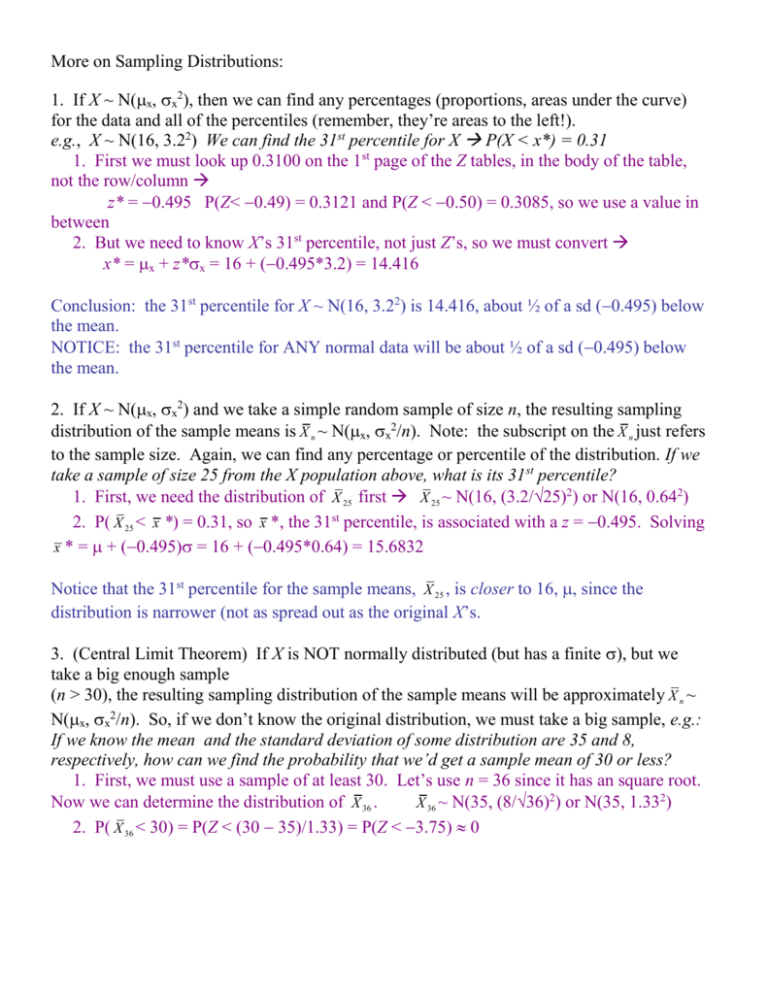
More on Sampling Distributions: 1. If X ~ N(x, x2), then we can find any percentages (proportions, areas under the curve) for the data and all of the percentiles (remember, they’re areas to the left!). e.g., X ~ N(16, 3.22) We can find the 31st percentile for X P(X < x*) = 0.31 1. First we must look up 0.3100 on the 1st page of the Z tables, in the body of the table, not the row/column z* = 0.495 P(Z< 0.49) = 0.3121 and P(Z < 0.50) = 0.3085, so we use a value in between 2. But we need to know X’s 31st percentile, not just Z’s, so we must convert x* = x + z*x = 16 + (0.495*3.2) = 14.416 Conclusion: the 31st percentile for X ~ N(16, 3.22) is 14.416, about ½ of a sd (0.495) below the mean. NOTICE: the 31st percentile for ANY normal data will be about ½ of a sd (0.495) below the mean. 2. If X ~ N(x, x2) and we take a simple random sample of size n, the resulting sampling distribution of the sample means is X n ~ N(x, x2/n). Note: the subscript on the X n just refers to the sample size. Again, we can find any percentage or percentile of the distribution. If we take a sample of size 25 from the X population above, what is its 31 st percentile? 1. First, we need the distribution of X 25 first X 25 ~ N(16, (3.2/25)2) or N(16, 0.642) 2. P( X 25 < x *) = 0.31, so x *, the 31st percentile, is associated with a z = 0.495. Solving x * = + (0.495) = 16 + (0.495*0.64) = 15.6832 Notice that the 31st percentile for the sample means, X 25 , is closer to 16, , since the distribution is narrower (not as spread out as the original X’s. 3. (Central Limit Theorem) If X is NOT normally distributed (but has a finite ), but we take a big enough sample (n > 30), the resulting sampling distribution of the sample means will be approximately X n ~ N(x, x2/n). So, if we don’t know the original distribution, we must take a big sample, e.g.: If we know the mean and the standard deviation of some distribution are 35 and 8, respectively, how can we find the probability that we’d get a sample mean of 30 or less? 1. First, we must use a sample of at least 30. Let’s use n = 36 since it has an square root. X 36 ~ N(35, (8/36)2) or N(35, 1.332) Now we can determine the distribution of X 36 . 2. P( X 36 < 30) = P(Z < (30 35)/1.33) = P(Z < 3.75) 0


